

Many candidates find IELTS Writing Task 1 tables difficult. Rows, columns, and numbers together sometimes haunt students, and they are not able to describe them. Most of the time, students copy the data as it is and only explain the numbers instead of describing the gist of the IELTS Task 1 table. This leads to a loss of bands as examiners check the understanding of the task.
Check Your IELTS Writing Section Preparation Now
IELTS writing task 1 table charts are among the most predictable and repeated question types. In this, examiners check if you can identify what the data is representing and how well you describe it. To help you score high in this task, here are expert tips, a structured template, sample questions with answers, along with mistakes to avoid. Start with understanding the template.
 Key Takeaways
- An IELTS Writing Task 1 table answer needs at least 150 words and should take about 20 minutes.
- Use a four-part structure with an introduction, an overview and two body paragraphs.
- Your overview should show the main features without detailed figures.
- Select and group the key figures instead of describing every number.
- Describe only what the table shows, without reasons or opinions.
Template for IELTS Table Task 1
Introduction (1–2 sentences):
- Paraphrase the task statement in your own words, and mention what the table shows, the place and the time period.
Example: “The table compares average monthly spending on three household categories across four cities between 2015 and 2020.”
Overview (2–3 sentences):
- After the introduction, explain the main features without quoting the exact data. Check the biggest change and the highest or lowest value. Take a look at the sharpest contrast and include that in your answer.
Example: “Overall, rent was the largest outgoing in every city, whereas spending on transport remained the lowest throughout the period.”
Body Paragraph 1 (3–4 sentences):
- Write the first group of data, such as one category or one set of rows. Support each point with specific figures.
Example: “In London, rent climbed to roughly 1,450 pounds a month by 2020, almost double the figure recorded in Leeds.”
Body Paragraph 2 (3–4 sentences):
- Cover the remaining data and compare it with the first paragraph where useful. Note any exceptions, since they show careful reading.
Example: “In Leeds, by contrast, transport costs stayed below 100 pounds a month throughout the period.”

Experience exam-style practice and get AI-powered insights to understand where you stand.

- Discover your strengths and areas to work on.
- Use detailed feedback to guide your next steps.
Tips For Scoring High in IELTS Writing Task 1 Table Chart
- Check the units before anything else. Confirm whether figures are percentages, thousands, dollars, or years. Missing that a column is measured in thousands is a common and costly slip.
- Plan for about two minutes. Circle the highest and lowest values, note the biggest change, and look for a pattern across the table. A short plan prevents long paragraphs that say very little.
- Decide your overview early. Even if you write it second, knowing your main points in advance keeps the response focused.
- Paraphrase the task statement. Replace “shows” with “illustrates” or “presents,” and vary “compares” where it fits. Vocabulary range is rewarded only when the words are used accurately.
- Vary your comparison language. Phrases such as “significantly higher than,” “roughly half of,” “the gap narrowed,” and “fell sharply to” keep the writing readable. Repeating one structure makes it monotonous.
- Round numbers sensibly. “Just under a fifth” or “approximately 12 million” is easier to follow than long decimals.
- Group data logically. Compare rows, compare columns, or organize by time period. Listing every number in sequence makes the response hard to follow.
- Aim for roughly 160 to 210 words. Going far beyond this wastes time, while writing fewer than 150 words can lower your Task Achievement score.
- Describe rather than explain. Task 1 asks what the data shows, not why it happened. Save reasons for Task 2.
- Practice with authentic tables. Cambridge IELTS books contain genuine examples, and you can also try IELTS Writing Task 1 practice questions on Gurully. Compare your answer with the model response and study how its overview is organized.
IELTS Writing Task 1 Table Sample Answers
Sample Question 1
Answer:
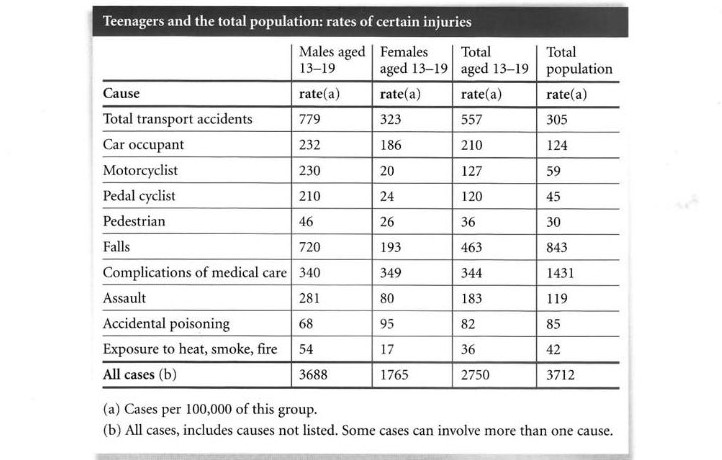
The table compares the rates of different types of injuries among teenagers aged 13–19, categorized by gender, with the corresponding figures for the overall population. The data is presented in cases per 100,000 people and covers several causes of injury.
Overall, males experienced considerably higher injury rates than females in most categories, particularly in transport accidents and assault. However, the total population recorded a higher overall injury rate, with complications of medical care and falls being the most prominent causes.
Looking at transport-related injuries, the rate among male teenagers stood at 779, compared with 323 for females, resulting in an overall figure of 557. Among the different categories, car occupants recorded the highest rate at 210, followed by motorcyclists at 127 and pedal cyclists at 120. In contrast, pedestrian injuries were considerably lower, at just 36 cases per 100,000 teenagers.
Regarding other causes, falls accounted for 463 cases among teenagers, while complications of medical care stood at 344. The latter figure was substantially lower than the 1,431 recorded for the total population. Similarly, the overall injury rate was 2,750 among teenagers, compared with 3,712 across the entire population.
Sample Question 2
Answer:
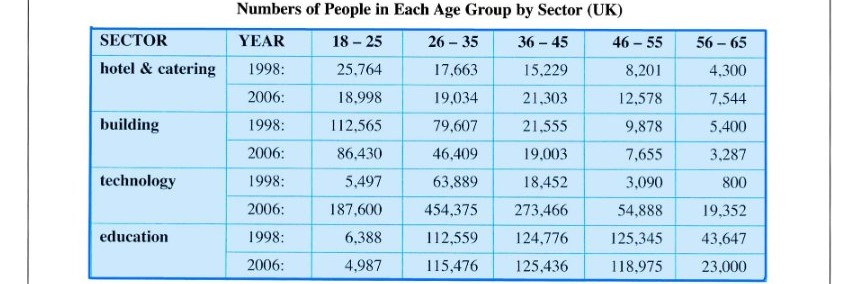
The table illustrates the number of people employed in four different sectors in the UK across five age groups in 1998 and 2006. The figures are categorized into hotel and catering, building, technology and education.
Overall, the technology sector experienced a remarkable increase in employment across all age groups between the two years. In contrast, the building sector witnessed a decline, while employment in education remained relatively stable.
Looking at hotel and catering, the number of employees aged 18–25 decreased from 25,764 in 1998 to 18,998 in 2006. However, the 26–35 and 36–45 age groups recorded increases, reaching 19,034 and 21,303, respectively. Similarly, the building sector experienced a considerable decline, particularly among younger workers, with the 18–25 group falling from 112,565 to 86,430.
Turning to technology, employment rose dramatically, especially among those aged 26–35, increasing from 63,889 to 454,375. The 18–25 group also saw substantial growth, reaching 187,600. Meanwhile, education showed only minor changes, with the 36–45 group becoming the largest, at 125,436 in 2006, compared with 124,776 in 1998.
Know Your Strengths. Find Your Gaps. Prepare Smarter.
- Understand Your Performance- Identify strengths and areas that need more attention.
- Track Your Progress – Review your performance across IELTS sections.
- Focus on What Matters- Use your feedback to plan more targeted preparation.
Sample Question 3
Answer:
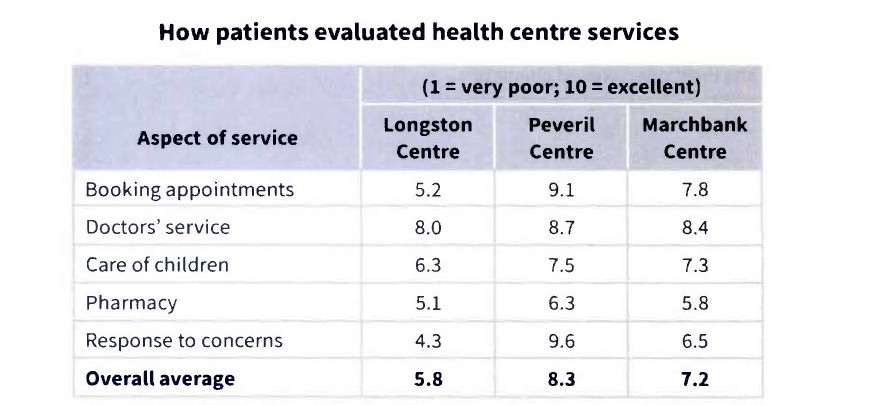
The table compares patients’ opinions of five aspects of healthcare services at three different health centers, namely Longston, Peveril and Marchbank. The services are rated on a scale of 1 to 10, with 1 representing very poor quality and 10 indicating excellent service.
Overall, Peveril Centre received the highest ratings across all five service categories and achieved the best overall average. In contrast, Longston Centre generally recorded the lowest scores, particularly for its response to patients’ concerns.
Looking first at appointment booking, Peveril Centre achieved the highest score of 9.1, considerably exceeding Marchbank’s 7.8 and Longston’s 5.2. A similar pattern can be observed in doctors’ services, where Peveril again ranked first with 8.7, followed closely by Marchbank at 8.4 and Longston at 8.0. Regarding childcare, Peveril maintained its lead with a rating of 7.5, while Marchbank and Longston received 7.3 and 6.3, respectively.
As for pharmacy services, all three centers obtained comparatively lower ratings, with Peveril scoring 6.3, compared with 5.8 at Marchbank and 5.1 at Longston. The greatest difference was seen in responses to patients’ concerns, where Peveril achieved an impressive 9.6, while Marchbank scored 6.5 and Longston just 4.3. Consequently, their overall averages stood at 8.3, 7.2 and 5.8, respectively.
Sample Question 4
Answer:
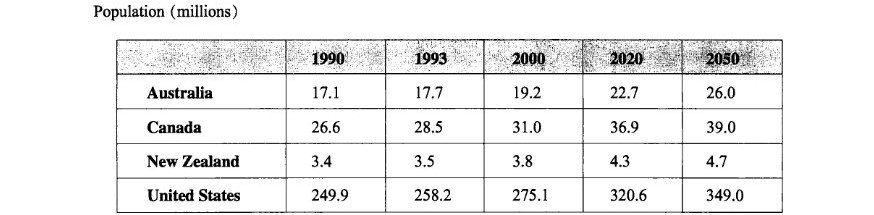
The table illustrates the population figures, measured in millions, for four countries, namely Australia, Canada, New Zealand and the United States, over five different years from 1990 to 2050. It includes both historical population data and future projections.
Overall, all four countries are expected to experience a gradual increase in population throughout the period. The United States consistently has the largest population, whereas New Zealand remains the least populated country.
Looking first at Australia and Canada, Australia’s population stood at 17.1 million in 1990 and increased slightly to 17.7 million in 1993. This figure then rose to 19.2 million in 2000, before reaching a projected 26 million by 2050. Similarly, Canada’s population grew from 26.6 million in 1990 to 31 million in 2000. It is forecast to rise further to 36.9 million in 2020 and 39 million by 2050.
Regarding New Zealand, its population increased steadily from 3.4 million in 1990 to 4.3 million in 2020, with a further rise to 4.7 million predicted by 2050. Meanwhile, the United States recorded the most significant growth, rising from 249.9 million in 1990 to 275.1 million in 2000. Its population is projected to reach 320.6 million in 2020 and 349 million by 2050.
Sample Question 5
Answer:
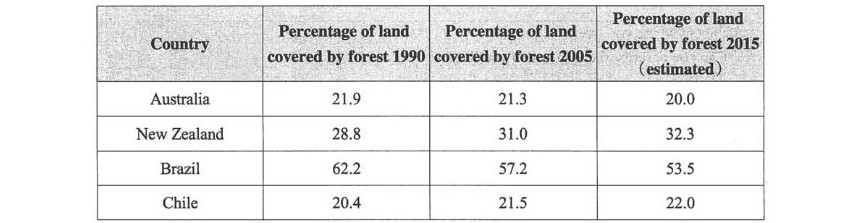
The table illustrates the percentage of land covered by forests in four countries, namely Australia, New Zealand, Brazil and Chile, in 1990 and 2005. It also provides estimated figures for forest coverage in 2015.
Overall, Brazil had the highest proportion of forest-covered land throughout the period, although its figure declined considerably. In contrast, New Zealand and Chile experienced steady increases, while Australia showed a gradual decrease in forest coverage.
Looking first at Australia and New Zealand, Australia had 21.9% of its land covered by forests in 1990. This figure fell slightly to 21.3% in 2005 and is estimated to have decreased further to 20% by 2015. In comparison, New Zealand experienced consistent growth, with forest coverage rising from 28.8% in 1990 to 31% in 2005. It is projected to reach 32.3% in 2015, making it the second-highest figure among the four countries.
Regarding Brazil and Chile, Brazil recorded the highest forest coverage, at 62.2% in 1990. However, this proportion dropped to 57.2% in 2005 and is estimated to decline further to 53.5% in 2015. Conversely, Chile showed a gradual upward trend, increasing from 20.4% in 1990 to 21.5% in 2005, with a further rise to 22% predicted for 2015.
Sample Question 6
Answer:
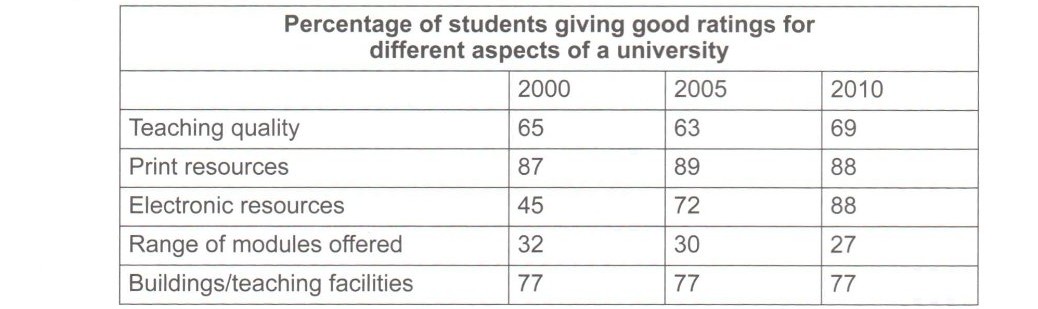
The table illustrates the percentages of students who gave positive ratings to five different aspects of a university in three separate years, 2000, 2005 and 2010. It compares students’ satisfaction levels regarding teaching quality, learning resources, available modules and university facilities over the ten-year period.
Overall, electronic resources experienced the most significant improvement, while the popularity of print resources remained consistently high throughout the period. In contrast, the range of modules offered received increasingly lower ratings, whereas satisfaction with buildings and teaching facilities remained unchanged.
Looking first at teaching quality, the proportion of students giving positive ratings stood at 65% in 2000, before falling slightly to 63% in 2005 and rising to 69% in 2010. Print resources received the highest ratings, increasing from 87% to 89% between 2000 and 2005, before declining marginally to 88% in the final year. Meanwhile, electronic resources showed a remarkable upward trend, climbing from 45% in 2000 to 72% in 2005 and reaching 88% in 2010.
In contrast, the range of modules offered recorded a gradual decline, dropping from 32% in 2000 to 27% in 2010. Regarding buildings and teaching facilities, the percentage remained stable at 77% across all three years, indicating no change in students’ satisfaction with this aspect.
Sample Question 7
Answer:
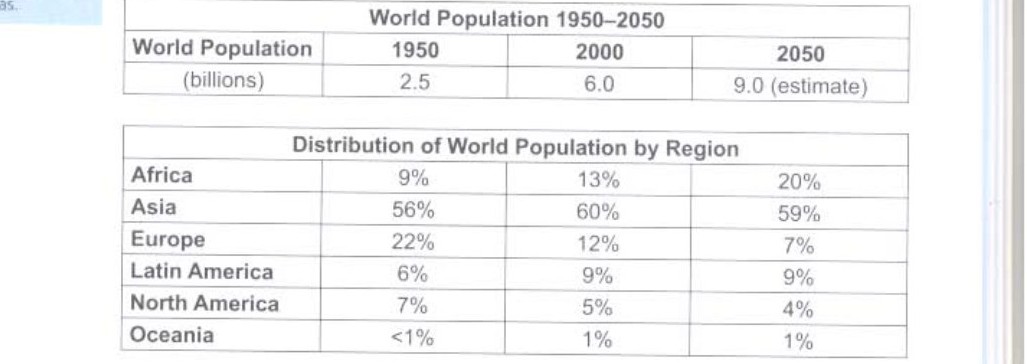
The tables illustrate changes in the total world population, measured in billions, and the percentage distribution of people across six different regions in 1950, 2000 and 2050. The figures for 2050 represent estimates of the expected population and its regional distribution.
Overall, the global population is predicted to increase considerably over the period, reaching 9 billion by 2050. Asia is expected to remain the most populated region, while Africa will experience the most significant growth in its share of the world’s population.
Looking at the total population, the world had approximately 2.5 billion people in 1950. This figure rose substantially to 6 billion by 2000 and is projected to reach 9 billion in 2050, representing more than a threefold increase over the century.
Regarding regional distribution, Asia accounted for the largest proportion, increasing from 56% in 1950 to 60% in 2000, before slightly declining to 59% in 2050. Africa’s share is expected to rise significantly from 9% to 20%. In contrast, Europe’s proportion will fall steadily from 22% to just 7%, while North America will decline from 7% to 4%. Latin America will increase from 6% to 9% and then remain stable. Meanwhile, Oceania will account for only 1% in both 2000 and 2050.
Sample Question 8
Answer:
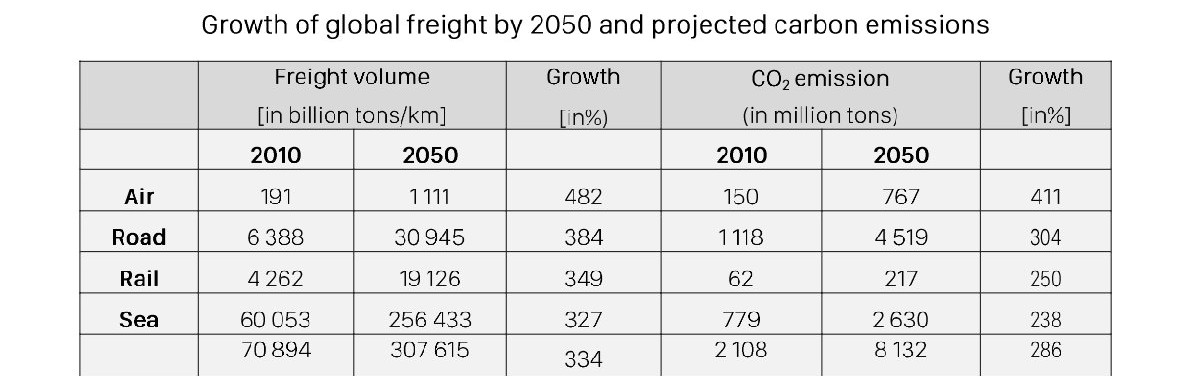
The transportation industry is expected to undergo considerable expansion over the next four decades, with freight activity and its environmental impact likely to increase substantially. The table provides a breakdown of projected changes in freight volumes and carbon dioxide emissions across four modes of transport between 2010 and 2050.
Overall, both freight volumes and CO₂ emissions are forecast to rise considerably by 2050. Sea transport will remain the dominant mode in terms of freight volume, while air transport is expected to experience the highest percentage growth in both categories.
In terms of freight volume, sea transport recorded the highest figure in 2010, at 60,053 billion tons/km, and is predicted to reach 256,433 by 2050. Road and rail freight are also expected to increase significantly, from 6,388 to 30,945 and from 4,262 to 19,126, respectively. Although air freight has the lowest volume, it will experience the fastest growth, at 482%.
Turning to carbon emissions, road transport produced the highest amount in 2010, at 1,118 million tons, which is projected to rise to 4,519 by 2050. Sea emissions will increase from 779 to 2,630 million tons. Meanwhile, air emissions will grow by 411%, compared with 304% for road, 250% for rail and 238% for sea transport.

Sample Question 9
Answer:
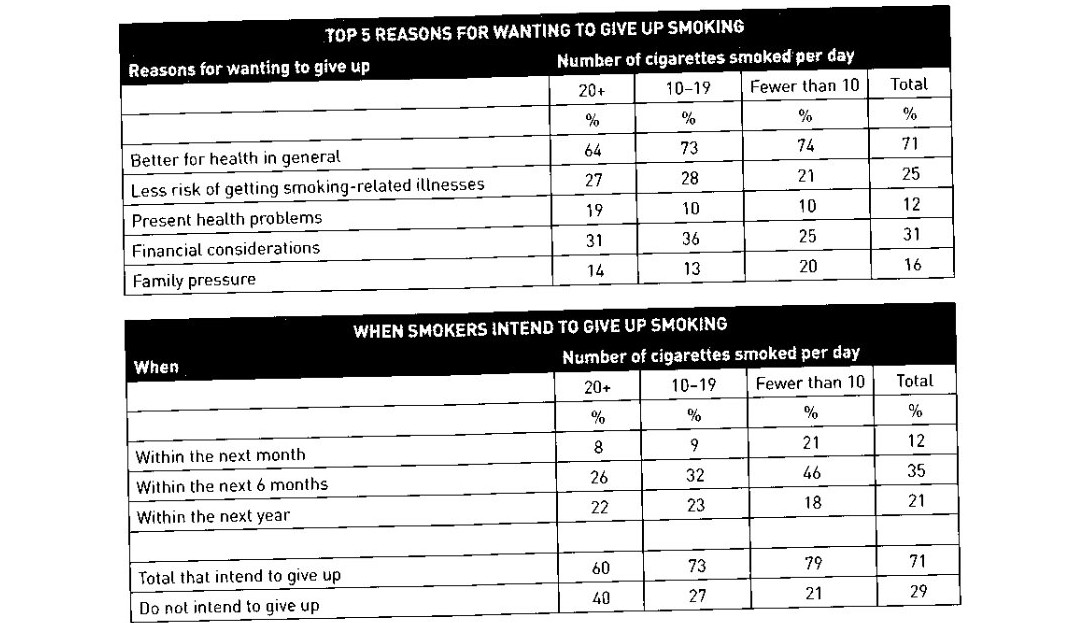
The tables compare smokers’ reasons for wanting to quit smoking and their intended timeframes for doing so, according to the number of cigarettes they consume daily. All figures are presented as percentages, with an overall total for each category.
Overall, improving general health was the most common motivation for quitting, whereas present health problems were the least common reason. Lighter smokers were more likely to plan giving up smoking, while heavier smokers showed a greater tendency to have no intention of quitting.
Looking first at the reasons, 71% of respondents cited general health, considerably higher than the 31% who mentioned financial concerns. A further 25% wanted to reduce the risk of smoking-related illnesses, while 16% referred to family pressure and 12% to existing health problems. The importance of general health was particularly high among lighter smokers, at 74%, compared with 64% of those consuming at least 20 cigarettes daily.
Regarding intentions, 35% planned to quit within six months, making this the most popular timeframe. Meanwhile, 21% intended to stop within a year and 12% within a month. Notably, 79% of light smokers intended to quit, compared with 60% of heavy smokers. Conversely, 40% of the heaviest smokers had no intention of giving up, almost twice the proportion of light smokers (21%).
Sample Question 10
Answer:
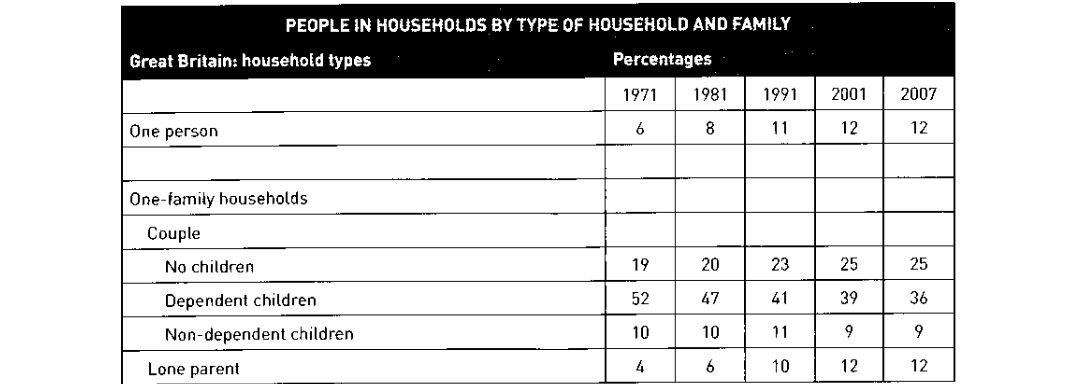
The table illustrates the percentages of people living in different household types in Great Britain over a 36-year period, from 1971 to 2007. It compares one-person households with various types of one-family households, including couples and lone-parent families.
Overall, the proportion of people living alone and in childless couples increased over the period, while the figure for couples with dependent children declined considerably. Meanwhile, the share of lone-parent households rose notably, while the figure for non-dependent children changed only slightly.
In 1971, only 6% of people lived alone, but this figure rose steadily to 12% in 2001 and remained unchanged in 2007. Similarly, the percentage of couples without children increased from 19% in 1971 to 25% in 2001, where it stabilized until the end of the period. These figures indicate a growing tendency towards smaller households.
In contrast, couples with dependent children accounted for the largest proportion in 1971, at 52%, but this figure gradually fell to 36% by 2007. The percentage of households with non-dependent children fluctuated slightly, reaching 9% in the final year. Meanwhile, lone-parent households increased from 4% to 12%, showing a notable upward trend.

Mistakes to Avoid
- Putting too many numbers in the overview. The overview should capture broad patterns. Save detailed figures for the body paragraphs.
- Describing every row or column. Selecting the most important information is a skill examiners notice. Trying to include everything produces a crowded report.
- Adding opinions or speculation. Phrases such as “this probably happened because” do not belong in this task. Stick to what the table shows.
- Copying the question wording word for word. Copied phrases do not show your own vocabulary range, so paraphrase them.
- Forgetting the units. A sentence such as “the figure rose to 45” leaves the reader guessing. Include the unit every time.
- Spending too long on the introduction. Keep the opening brief so that the body and overview receive enough time.
Practice more questions like these on Gurully. Get access to full-length mock tests with accurate scoring and a real-time exam simulation that prepares you for the actual test. Practice in an exam-like environment, identify your weak areas, and work toward achieving your desired score. With section-by-section and question-by-question practice, you can focus on improving every skill, track your progress, and build confidence across all sections.
FAQs
How do I describe a table in IELTS Writing Task 1?
How many words should I write for an IELTS Writing Task 1 table?
Do I need to include every number from the table in my answer?
What should I write in the overview for an IELTS table chart?
How should I group the data in an IELTS Writing Task 1 table?
How long should I spend on an IELTS Writing Task 1 table question?
Also Read
IELTS Writing Task 1 Pie Chart
IELTS Writing Task 1 Bar Chart
IELTS Writing Task 1 Line Graph
Do Free IELTS Writing Practice