
Pie charts look like the easiest visuals in IELTS Academic Writing Task 1. They are just circles divided into percentages, so many students assume they can describe them quickly and move on. In reality, IELTS pie charts often cost students valuable marks.
The usual problem is that writers list every slice one by one, which produces a dull, number-heavy answer that never shows the examiner they understand the data. Examiners want to see selection, comparison, and clear organization, not a catalog of figures. If you can identify the main trends, write a solid overview, and make a few accurate comparisons, you can aim for a strong band score.
This guide gives you a practical template you can adapt to almost any pie chart, tips that will sharpen your answers, and common mistakes to avoid, along with most frequently repeated sample questions and answers.
Check how much you are scoring in Pie Chart
IELTS Writing Task 1 Pie Chart Template
Paragraph 1: Introduction (1 to 2 sentences)
Paraphrase the title of the chart without copying it word for word.
- Example: The two pie charts show how household spending was divided among four categories in Country X in 2010 and 2020.
Paragraph 2: Overview (2 to 3 sentences)
Name the main trends in general terms, without giving exact figures.
- Example: Overall, housing was the largest expense in both years, while spending on food fell noticeably over the decade.
Paragraph 3: Details for the first chart (3 to 4 sentences)
Mention the largest and smallest categories with their percentages.
- Example: In 2010, housing accounted for 35% of spending, followed by transport at 20%. Food made up 25%, while entertainment was the smallest category at 5%.
Paragraph 4: Details for the second chart and comparison (3 to 4 sentences)
Describe the changes and compare the two charts directly rather than repeating the same pattern.
- Example: By 2020, housing’s share had risen to 40%, whereas food had dropped to 18%. Entertainment doubled to 10%, while transport stayed relatively stable at around one-fifth of the total.

Tips To Score 7+ Bands in IELTS Pie Chart
Start with the overview
- Before you write any detail sentences, decide the two or three most important trends. Your overview is the foundation of your Task Achievement score, and it also helps you choose which figures deserve a place in your answer. If you skip this step, your writing will drift into a list.
Plan for about three minutes
- Spend the first two or three minutes reading the title, labels, and units, then jot down the largest slice, the smallest slice, and any major change. A short plan saves time and stops you from forgetting key information halfway through.
Aim for 170 to 190 words
- The minimum is 150 words, and falling below it means an automatic penalty. Writing far beyond 190 words takes time you need for checking and increases your chances of making grammar mistakes.
Check the units before anything else
- Some pie charts show percentages, others show numbers of people, and some show amounts of money in a particular currency. Misreading the unit can change the whole meaning of your answer, so confirm it at the start.
Compare, don’t just describe
- When there are two charts, the examiner wants to see that you can connect them. Use comparative language such as “in contrast,” “whereas,” “by comparison,” and “similarly” to show the relationship between the two pies.
Use approximation language
- Phrases like “just under a third,” “roughly one-fifth,” and “nearly half” sound natural and show that you can express proportions flexibly. They also help when the exact figure is hard to state neatly.
Vary your verbs for proportions
- Repeating “was” or “is” in every sentence makes your writing flat and can lower your Lexical Resource score. Try “accounted for,” “made up,” “constituted,” or “represented” to keep the language fresh.
Review your overview against a model answer
- After practicing, compare your overview with a strong sample. Most students neglect this part, and examiners notice it first, so it deserves extra attention during revision.
Vocabulary for IELTS Pie Chart
Use a mix of percentages, fractions and proportion verbs so your answer does not repeat the same figures and phrases.
| Percentage | Fraction or phrase |
| 75% | three quarters |
| 70% | just over two thirds |
| 50% | half |
| 48% | just under half |
| 33% | about a third |
| 25% | a quarter |
| 20% | a fifth |
| 10% | one in ten |
| 5% | a small fraction |

| Phrase | Example sentence |
| account for | Housing accounted for 40% of household spending in 2010. |
| make up | Food made up almost a third of the total. |
| constitute | Entertainment constituted the smallest share, at 10%. |
| represent | Transport represented one-fifth of spending in both years. |
| the largest share | Housing had the largest share in both years. |
| more than twice as much as | In 2020, households spent more than twice as much on housing as on food. |
| compared with | Food fell to 20%, compared with 30% in 2010. |
IELTS Pie Chart Sample Questions With Answers
Sample Question 1:
Answer:
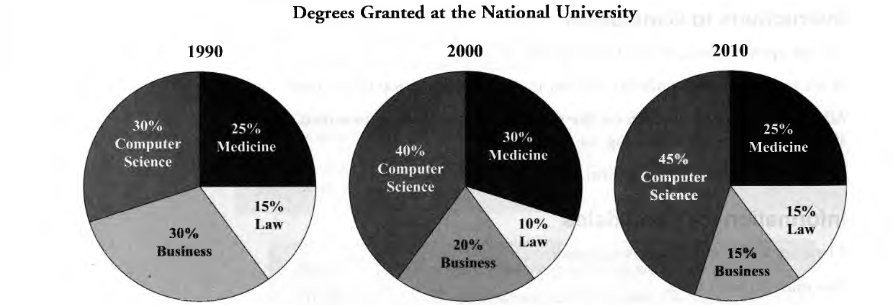
The pie charts illustrate the percentages of degrees awarded in four different subjects at the National University in 1990, 2000, and 2010.
Overall, Computer Science became increasingly popular over the period, while the proportion of Business degrees declined considerably. Medicine remained relatively stable, whereas Law accounted for the smallest share in 2000.
In 1990, Computer Science and Business were equally popular, each representing 30% of the degrees awarded. Medicine accounted for 25%, making it the third-largest category. Meanwhile, Law had the lowest proportion, at just 15%. Together, these figures show that Computer Science and Business dominated university degrees at the beginning of the period.
By 2000, Computer Science had risen to 40%, becoming the leading subject, while Business fell to 20%. Medicine increased to 30%, whereas Law declined to 10%. In 2010, Computer Science climbed further to 45%, while Business dropped to 15%. Medicine returned to 25%, its original level, and Law recovered to 15%. Thus, Computer Science experienced the greatest overall growth.
Sample Question 2:
Answer:
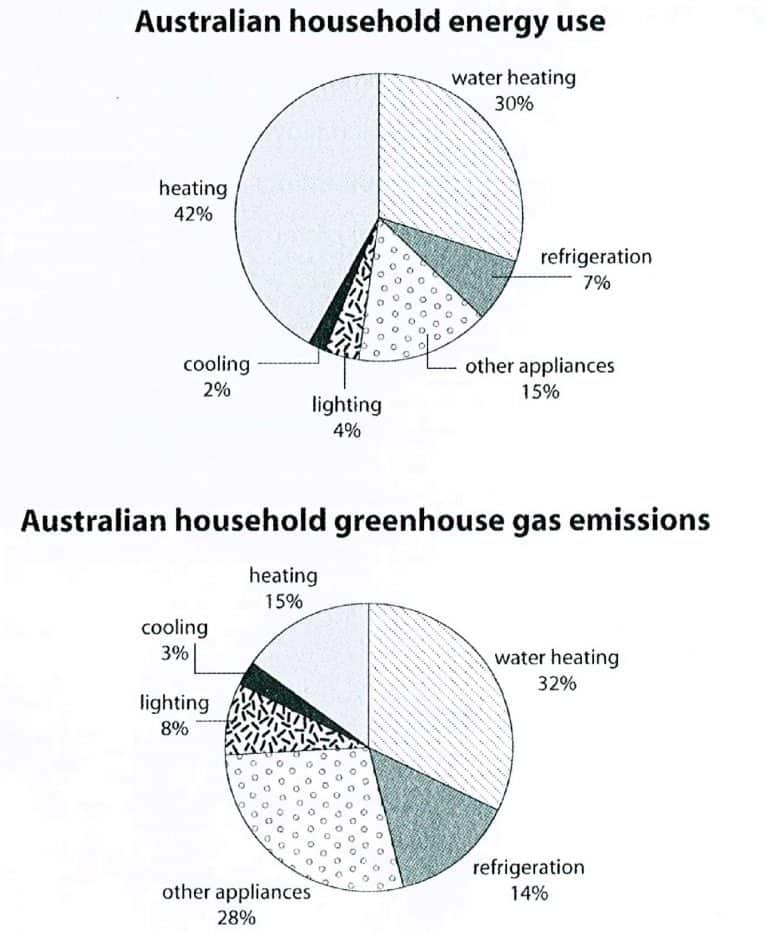
The two pie charts compare the proportions of energy consumed by different household activities in Australia and the greenhouse gas emissions produced by these activities.
Overall, heating accounted for the largest share of household energy use, while water heating produced the highest proportion of greenhouse gas emissions. Notably, heating consumed a significant amount of energy but generated a comparatively smaller percentage of emissions.
Regarding energy consumption, heating was the largest category, representing 42% of total household energy use. Water heating ranked second at 30%, followed by other appliances at 15%. In contrast, refrigeration accounted for 7%, while lighting and cooling consumed the smallest proportions, at 4% and 2%, respectively.
In terms of greenhouse gas emissions, water heating was the leading contributor at 32%, followed by other appliances at 28%. Heating produced only 15% of emissions, despite accounting for 42% of energy use. Similarly, refrigeration’s contribution doubled from 7% of energy consumption to 14% of emissions. Lighting also increased from 4% to 8%, while cooling rose slightly from 2% to 3%.
Sample Question 3:
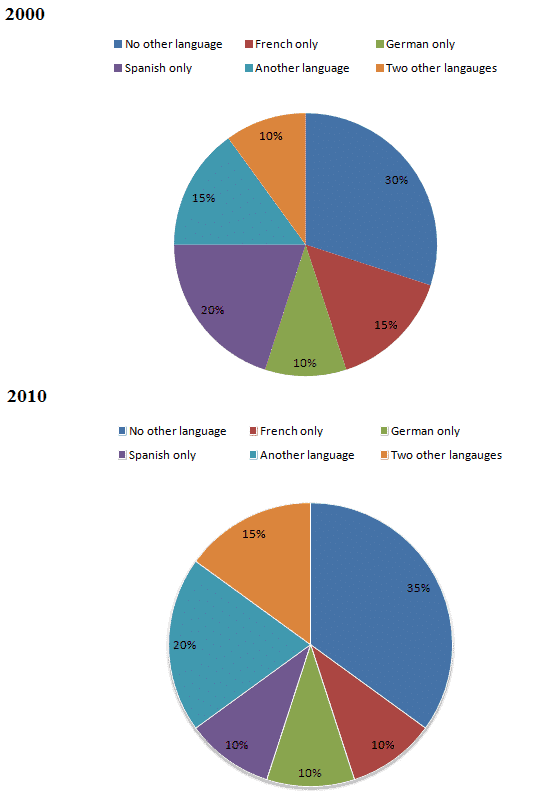
Answer:
The two pie charts illustrate the proportions of people speaking different numbers and types of languages in 2000 and 2010.
Overall, the percentage of people who spoke no other language increased over the period. In contrast, the proportion of Spanish-only speakers declined, while the figures for people speaking additional languages generally showed an upward trend.
In 2000, people who spoke no other language accounted for the largest proportion, at 30%. Spanish-only speakers represented the second-largest group, making up 20% of the total. French-only speakers and those speaking another language each constituted 15%. Meanwhile, German-only speakers and people who spoke two other languages recorded the lowest figures, at 10% each.
By 2010, the proportion of people speaking no other language had risen by 5 percentage points to 35%, remaining the largest category. Similarly, the figures for speakers of another language and two other languages increased to 20% and 15%, respectively. However, Spanish-only speakers experienced a significant fall from 20% to 10%. French-only speakers also declined to 10%, whereas the proportion of German-only speakers remained unchanged at 10%.
Sample Question 4:
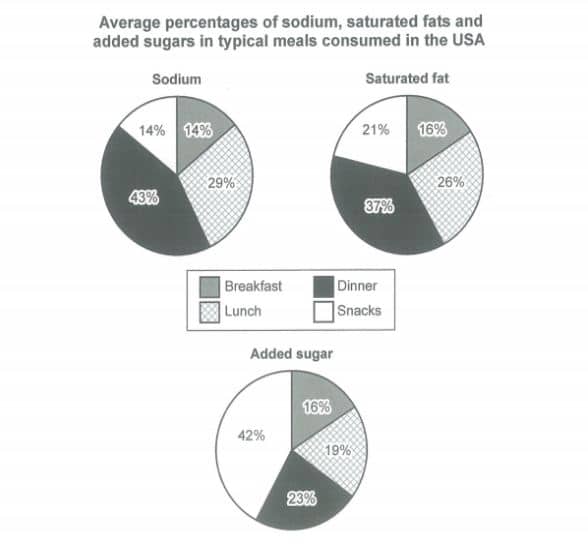
Answer:
The three pie charts illustrate the average percentages of sodium, saturated fat and added sugar contained in four typical meals consumed by people in the USA.
Overall, dinner contains the highest proportion of sodium and saturated fat, whereas snacks account for the largest share of added sugar. In contrast, breakfast consistently represents the smallest or one of the smallest proportions across the three nutrients.
Regarding sodium, dinner makes up the largest percentage, at 43%, followed by lunch at 29%. Breakfast and snacks both account for 14% each. A similar pattern can be seen in saturated fat, with dinner contributing 37%, while lunch represents 26%. Snacks account for 21%, compared with only 16% for breakfast.
In terms of added sugar, snacks have the highest proportion, at 42%, which is almost twice the figure for dinner, at 23%. Lunch accounts for 19%, while breakfast has the lowest percentage, at 16%. Notably, snacks contribute considerably more added sugar than sodium or saturated fat, whereas dinner is the main source of the other two nutrients.
Sample Question 5:
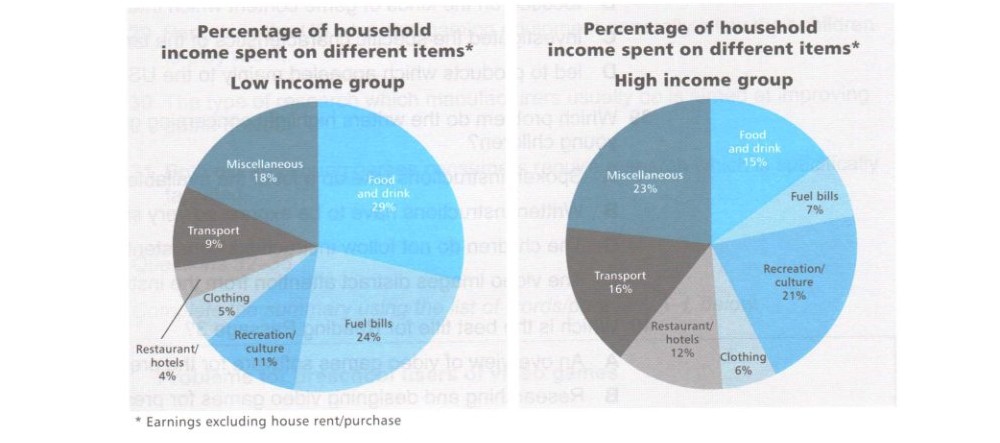
Answer:
The two pie charts compare how households in the low-income and high-income groups spend their income on various items, excluding house rent and purchase.
Overall, low-income households spend the largest proportion of their income on food and drink, whereas high-income households allocate the highest percentage to miscellaneous expenses. Additionally, high-income families spend more on recreation, transport and restaurants, while low-income families devote more money to food and fuel bills.
In the low-income group, food and drink account for the highest proportion, at 29%, followed by fuel bills at 24%. Miscellaneous expenses represent 18% of household income, while recreation and culture make up 11%. Transport accounts for 9%, whereas clothing and restaurant or hotel expenses are the smallest categories, at 5% and 4%, respectively.
By contrast, miscellaneous expenses constitute the largest share among high-income households, at 23%, followed by recreation and culture at 21%. Food and drink account for only 15%, compared with 29% in the low-income group. High-income households also spend more on transport (16%) and restaurants or hotels (12%), while their expenditure on fuel bills is considerably lower, at just 7%.
Sample Question 6:
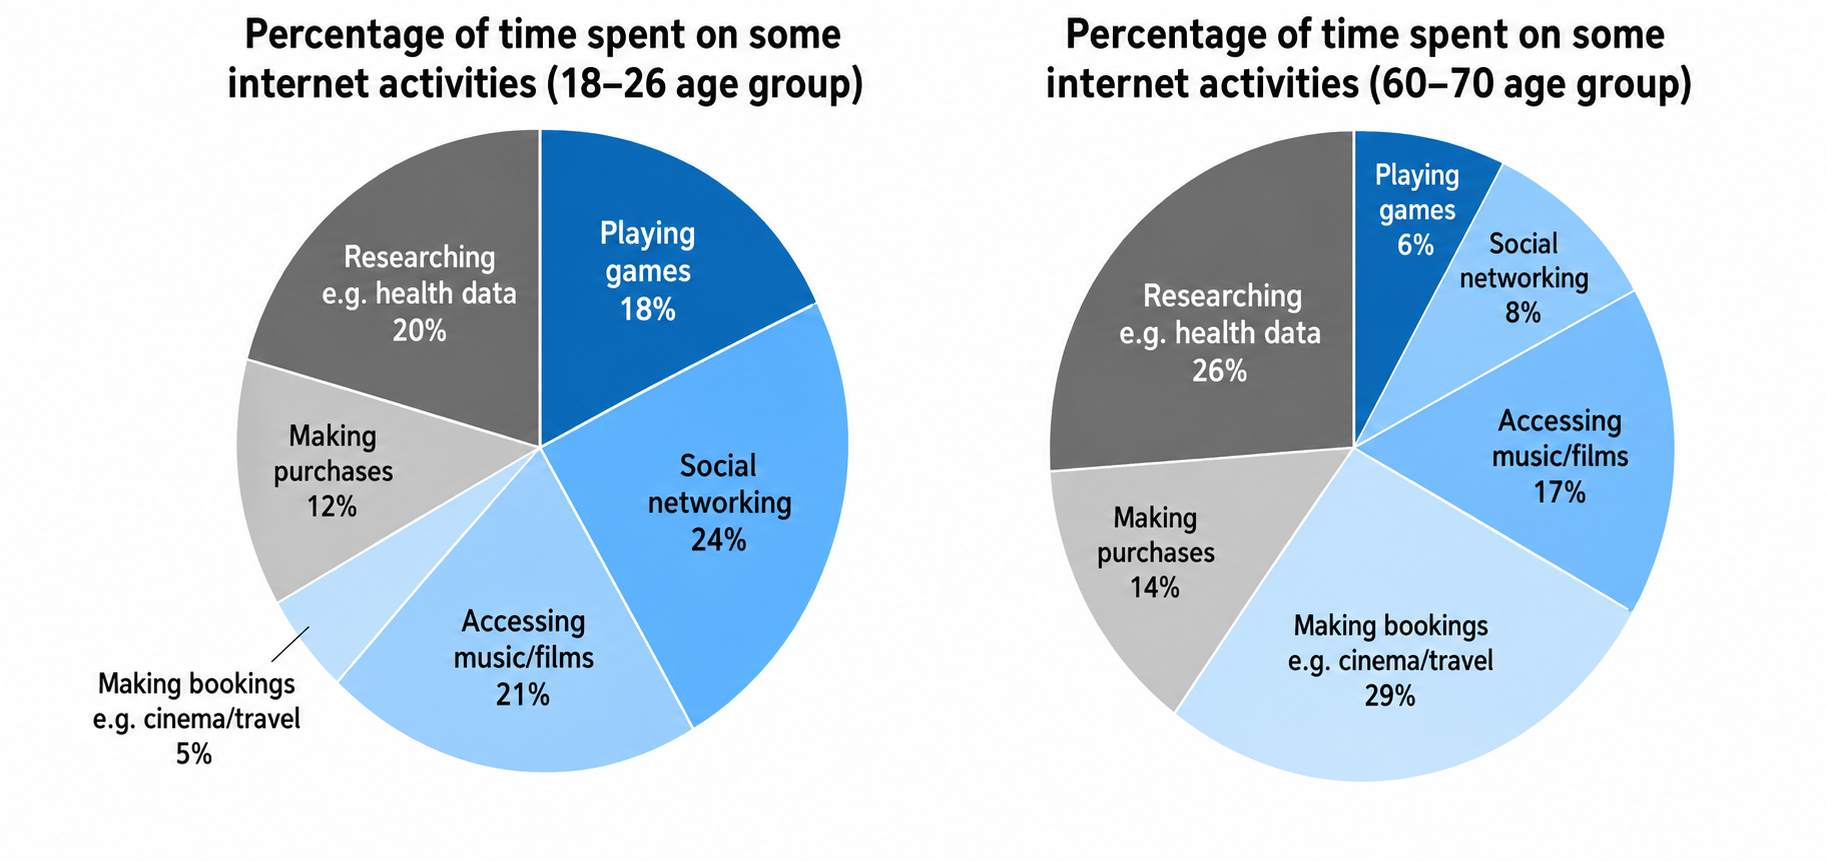
Answer:
The two pie charts illustrate how people in two different age groups, namely 18–26 and 60–70, allocate their time to various internet activities, expressed as percentages.
Overall, younger people spend more time on social networking and playing games, whereas older individuals devote a greater proportion of their time to making bookings and researching health-related information. Accessing music and films accounts for a relatively similar share in both groups.
Looking at the first chart, social networking represents the largest proportion of internet usage among 18–26-year-olds, at 24%, followed by accessing music and films at 21%. Researching health data accounts for 20%, while playing games makes up 18%. Making purchases represents 12% of the total, whereas making bookings is the least popular activity, at just 5%.
Turning to the older age group, making bookings becomes the most common activity, accounting for 29%, compared with only 5% among younger users. Researching health data also increases from 20% to 26%. In contrast, playing games and social networking decline considerably to 6% and 8%, respectively, while online purchases rise slightly to 14%.
Sample Question 7:
Answer:
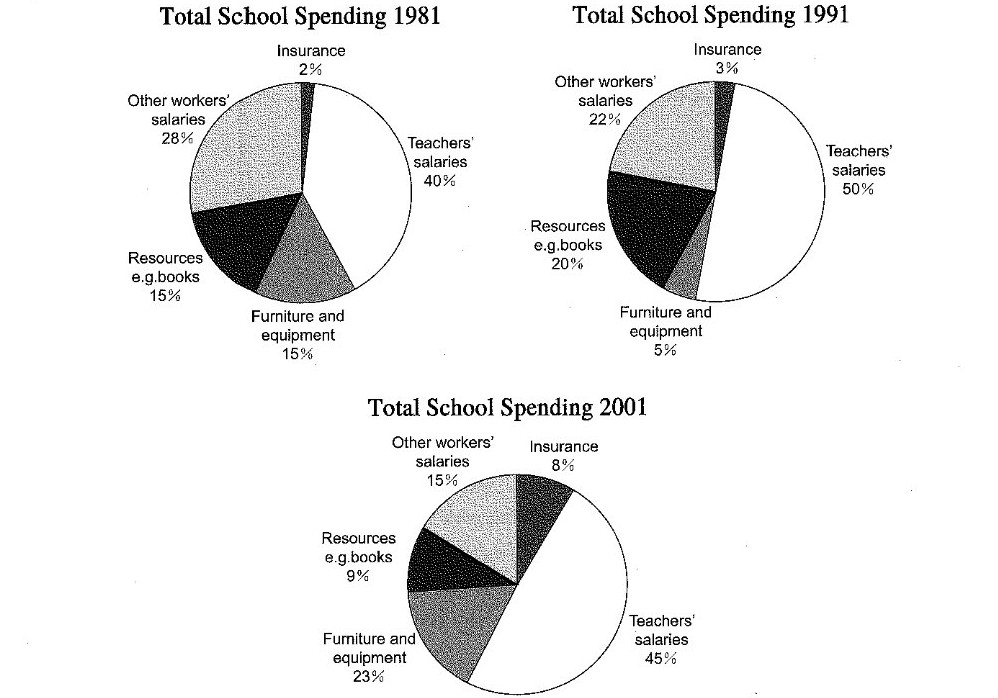
The three pie charts illustrate the distribution of total school expenditure across five different categories in 1981, 1991 and 2001, with figures given as percentages.
Overall, teachers’ salaries accounted for the largest proportion of school spending throughout the period, while insurance consistently represented the smallest share. It is also noticeable that spending on teachers’ salaries and furniture and equipment generally increased, whereas expenditure on other workers’ salaries declined.
Looking first at 1981, teachers’ salaries made up the highest percentage of total expenditure, at 40%, followed by other workers’ salaries at 28%. Resources and furniture and equipment each accounted for 15% of the budget, while insurance received the smallest allocation, at just 2%.
In 1991, teachers’ salaries rose significantly to 50%, before falling slightly to 45% in 2001. Meanwhile, spending on other workers’ salaries decreased steadily from 28% to 15%. Resources peaked at 20% in 1991 but dropped to 9% by 2001. In contrast, furniture and equipment fell to 5% in 1991 before rising sharply to 23% in 2001. Insurance expenditure also increased gradually, reaching 8%.
Sample Question 8:
Answer:
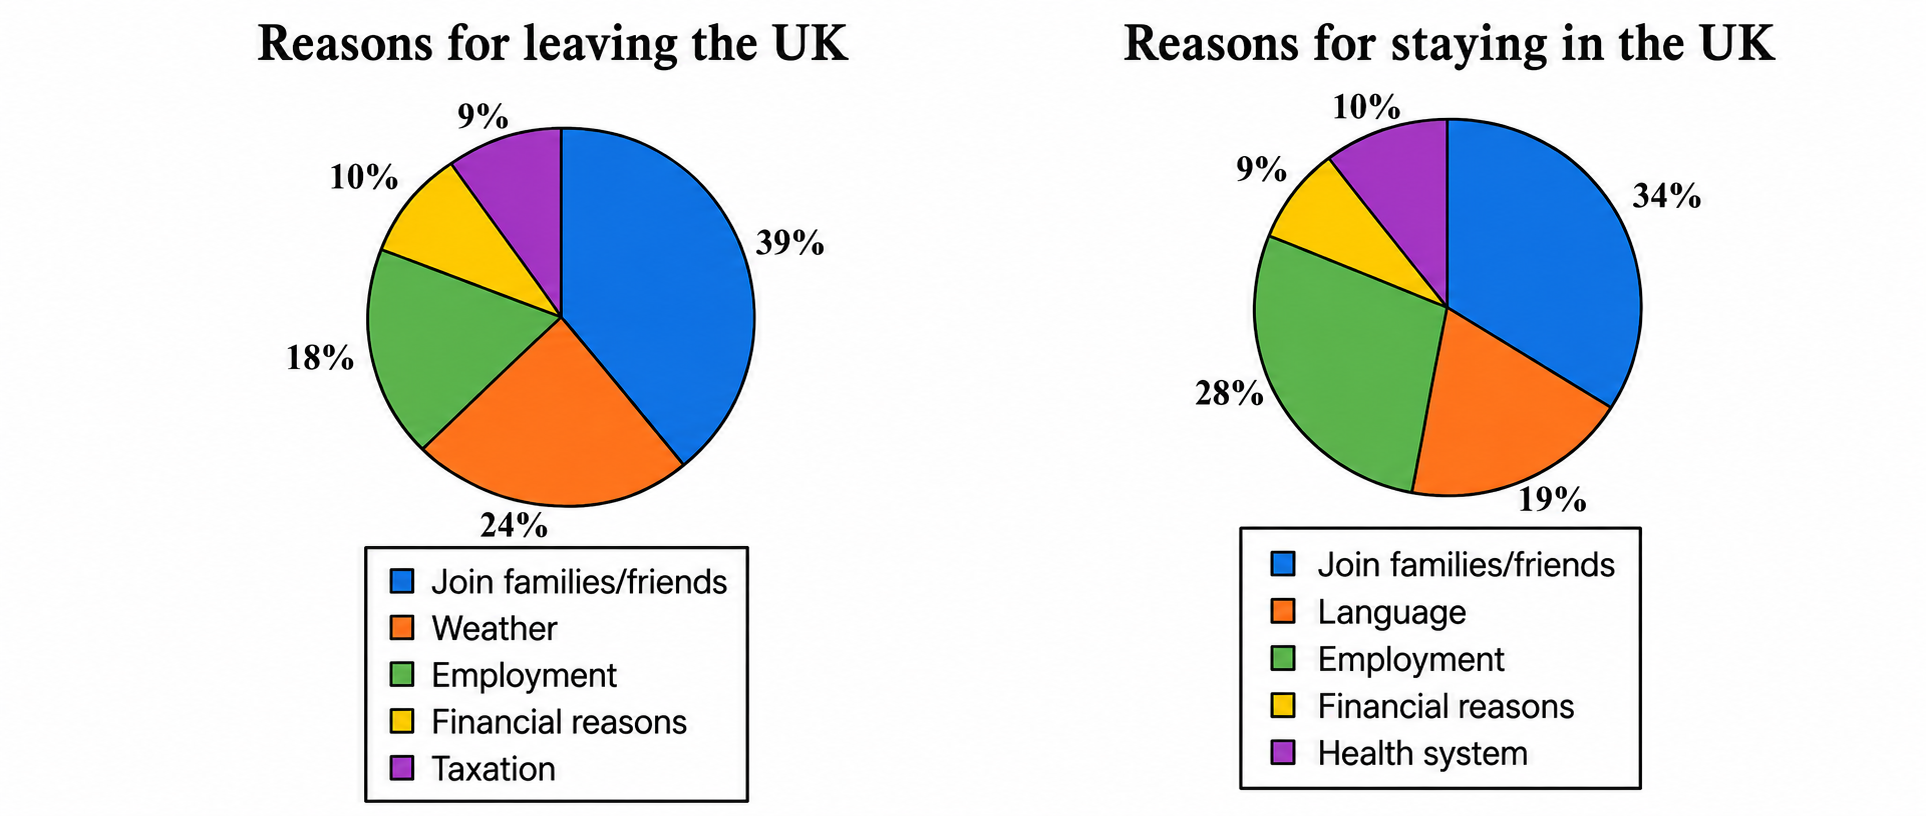
The two pie charts illustrate the various reasons why people choose to leave or remain in the UK, with each category represented as a percentage.
Overall, joining family members or friends is the most common reason for both leaving and staying in the UK. However, weather is a major factor influencing people to leave, whereas employment plays a more significant role in people’s decision to stay.
Looking at the first chart, 39% of people leave the UK to join their families or friends, making this the largest category. Weather is the second most common reason, accounting for 24%, followed by employment at 18%. Meanwhile, financial reasons and taxation represent relatively smaller proportions, at 10% and 9%, respectively.
Turning to the reasons for staying, joining family members or friends remains the leading factor, although its figure decreases slightly to 34%. Employment rises considerably from 18% to 28%, becoming the second most significant reason. In contrast, language accounts for 19%, while health-related reasons and financial considerations make up 10% and 9%, respectively. Thus, employment is notably more influential among those staying in the UK.
Sample Question 9:
Answer:
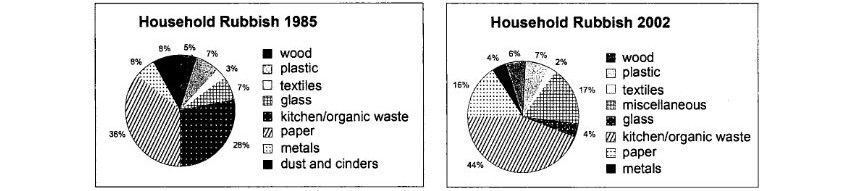
The two pie charts compare the proportions of different types of household rubbish in 1985 and 2002. They illustrate how the composition of domestic waste changed over this 17-year period.
Overall, paper and metals accounted for the largest shares in 1985, whereas kitchen and organic waste became the dominant category in 2002. The most noticeable changes were the significant increase in organic waste and the decline in paper and metals.
In 1985, paper was the largest component, at 36%, followed by metals at 28%. Glass and kitchen/organic waste each made up 8%, while textiles represented 7%. Wood accounted for 5%, and dust and cinders also constituted 5%. Plastic was the smallest category, at just 3%.
By 2002, kitchen/organic waste had risen dramatically to 44%, becoming the largest category. Paper fell to 16%, while metals dropped substantially to 6%. Textiles increased to 17%, whereas wood and plastic accounted for 7% and 2%, respectively. Glass and miscellaneous waste each stood at 4%.
Sample Question 10:
Answer:
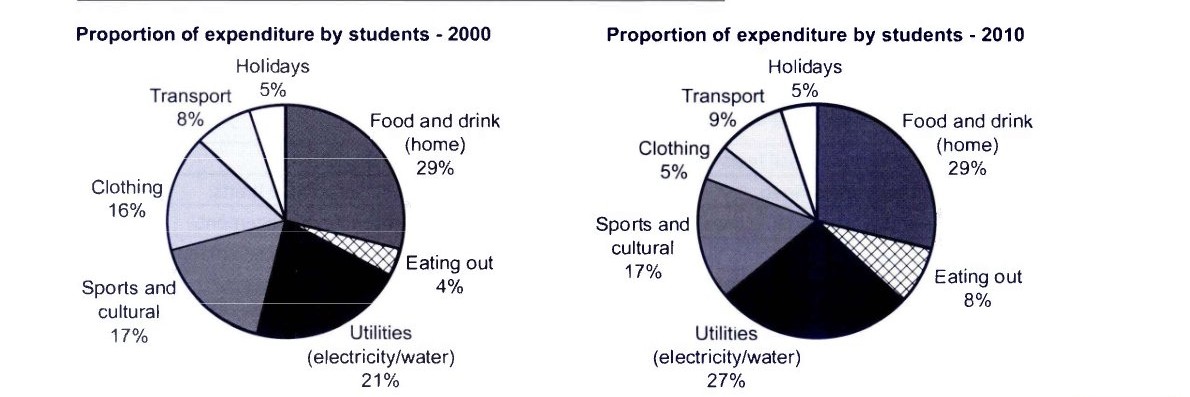
The two pie charts illustrate how students distributed their expenditure among seven different categories in 2000 and 2010.
Overall, food and drink at home accounted for the largest proportion of students’ spending in both years, while holidays remained the smallest category. The most noticeable changes were the increases in spending on utilities and eating out, whereas expenditure on clothing declined considerably.
In 2000, students spent the highest proportion of their money on food and drink at home, at 29%, followed by utilities, which represented 21%. Sports and cultural activities accounted for 17%, while clothing made up 16%. Transport and holidays represented 8% and 5%, respectively. Eating out was the least significant expense, at just 4%.
By 2010, spending on food and drink at home remained unchanged at 29%, whereas utilities increased from 21% to 27%. Similarly, expenditure on eating out doubled to 8%, while transport rose slightly to 9%. In contrast, clothing fell sharply from 16% to 5%, while spending on sports and cultural activities and holidays remained stable at 17% and 5%, respectively.
Mistakes to Avoid
- Describing every slice. Choosing a few significant figures is far more effective than listing all of them. Let your overview summarize the general picture while your detail paragraphs highlight the most important points.
- Giving personal opinions. Task 1 asks you to describe data, not to argue a position. Phrases like “I think the government should…” have no place in this answer, so keep every sentence grounded in what the chart shows.
- Adding information that isn’t in the chart. Even if you know the real-world reasons behind a trend, leave them out. Examiners assess how accurately you report the data, and speculation can pull your answer away from the task.
- Making calculation errors. If you mention a total, a fraction, or the difference between two values, check your math before moving on. A wrong subtraction, such as stating a 6% rise when the figures actually show 5%, can cost you marks for accuracy.
- Using inconsistent tenses. Use the past simple for completed years shown in the chart, and keep that choice consistent throughout your response. Switching between past and present without a clear reason confuses the reader and weakens your Grammatical Range and Accuracy score.
You can practice more questions on Gurully’s AI-powered platform, where you’ll get access to full-length mock tests with instant scoring to evaluate your performance. Make the most of section-wise and question-wise practice to strengthen your skills, focus on specific question types, and identify areas for improvement.
Practice as much as you need to become more familiar with different question patterns, build confidence, and improve your performance. With consistent practice and the right preparation, you can work towards achieving your desired band score.