IELTS Writing Task 1 Practice (Academic)
Improve your skills with regular IELTS Writing Task 1 practice and learn how to describe charts, graphs, maps, and diagrams effectively.
PTE
AI-Scored Mock Tests To Study And Settle Abroad.IELTS
Computer-Delivered Scored Mock Tests To Study And Settle Abroad.DUOLINGO
Score high on the most convenient English Proficiency test in the world.CELPIP
Best Platform To Meet Canadian Immigration Requirements.Improve your skills with regular IELTS Writing Task 1 practice and learn how to describe charts, graphs, maps, and diagrams effectively.
Review the visual information provided and describe it in your own words. Summarise the main features, compare relevant details, and highlight any important patterns or trends. Present your response in a clear and organised way.
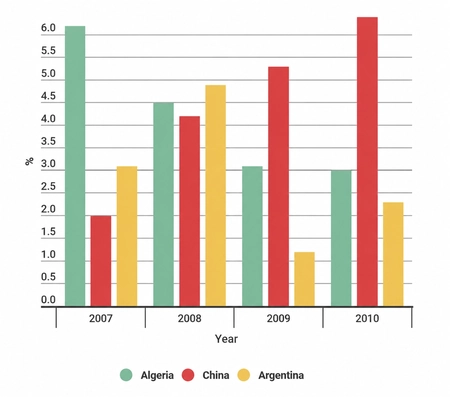
The bar graph below shows the percentage growth in average property prices in three different countries between 2007 and 2010.
Summarise the information by selecting and reporting the main features and make comparisons where relevant.
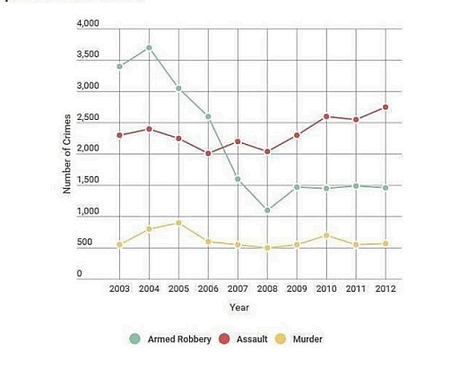
The line graph below shows the number of serious crimes that occurred in London between 2003 and 2012.
Summarise the information by selecting and reporting the main features and make comparisons where relevant.
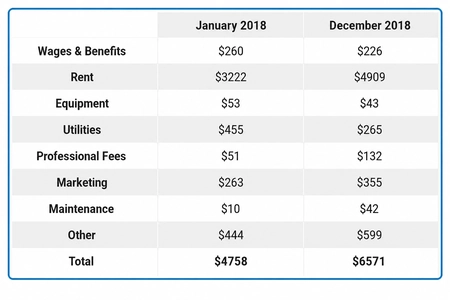
The table below shows the expenses of a used bookstore in Scotland for the first and last month of the same year.
Summarise the information by selecting and reporting the main features and make comparisons where relevant.
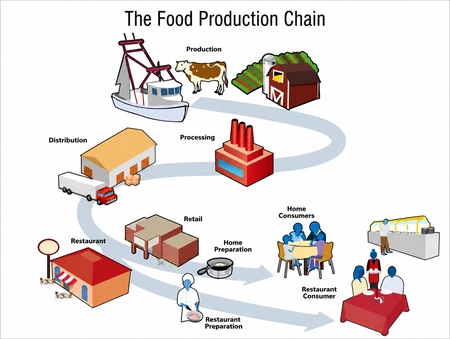
The diagram below shows the stages in the food production chain of the United States.
Summarise the information by selecting and reporting the main features and make comparisons where relevant..
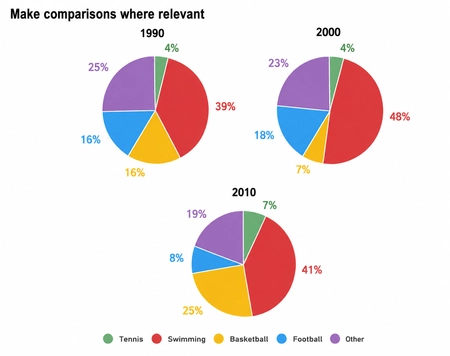
The pie charts below illustrate the most popular sports in French secondary schools in three different years.
Summarise the information by selecting and reporting the main features and make comparisons where relevant.
Word Count: 0
Sample Answer :
The chart illustrates by what percentage the prices of properties increased in Algeria, China and Argentina between 2007 and 2010.
Overall, Algeria and China experienced the largest increases in property prices; however, the percentages for Algeria fell over the period, while there was a steady rise in percentage growth in China. The numbers for Argentina fluctuated between 2007 and 2010.
In 2007 property prices in Algeria rose by just over 6%, which was by far the highest value in that year. Over the 3-year period, the percentage growth decreased to exactly 3% in 2010. China, on the other hand, had the lowest value in 2007 with only 2% but that number rose steadily to reach nearly 6.5% in 2010, representing the highest value for that year.
The increase in property prices in Argentina fluctuated over the period, starting off with just over 3% in 2007, peaking in 2008 at nearly 5%, then dropping to just over 1% in 2009 and finally rising again to reach about 2.3% in 2010.
Sample Answer :
The line graph displays information about how many assaults, murders and armed robberies were committed in London from 2003 to 2012.
Overall, the number of armed robberies dropped significantly, whereas assaults increased throughout the period of time given. The number of murders maintained relatively stable between 2003 and 2012.
The figure for armed robbery in London started at just under 3,500 crimes in 2003 and it had a slight increase to just over 3,500 before falling dramatically to just over 1,000 in 2008. By 2009, it rose to around 1,500 and maintained stable for the next three years.
The number of assaults began at just under 2,500 in 2003, and it fluctuated between 2,000 and 2,500 crimes from 2004 to 2008; however, in 2009 there was a growth to 2,300 crimes approximately, and by the end of the period it increased to around 2,700. The amount of murders started at around 500 in 2003, and it reached a peak of just under 1,000 crimes in 2005 before falling back to just over 500 in 2006. From 2006 to 2012 the number of assaults maintained stable to around 500 and 700.
Sample Answer :
The table displays the expenditure of a used book shop in Scotland in January 2018 and December 2018.
Overall, the total expense increased in the year, while the amount spent on wages and benefits, equipment, utilities decreased. Rental expenditure had the most dramatic increase among all the expenses. Spendings on professional fees, marketing, maintenance and other rose moderately
In January, the total expense was $4,758, and this number soared to $6,571 in December in the same year. However, the expenses of wages and benefits fell slightly, from $260 to $226. Similarly, money spent on equipment also slightly went down, from $53 to $43. Utilities had the most significant decrease, with $455 in January and $265 in December.
The most obvious increase was the expense in rent, from $3,222 in the first month to $4,909 in the final month. Expenses of professional fees, marketing, maintenance and other rose from $51 to $132, $263 to $355, $444 to $599 respectively.
Sample Answer :
The illustration demonstrates how food is produced in the United States.
Overall, it is a 9 stage, man-made, linear process. It begins with the production of meat, fish and vegetables, and finally results in people consuming prepared food, either at restaurants or at home.
First of all, the primary materials for production of food are obtained by three different sources, which are the fishing, agriculture and farming industries. These materials are sent to a factory in order to be processed and, after that, processed food is sent to a distribution center.
Following that, food is delivered from the distribution center to either retail or restaurants. When it is sent to restaurants, the food is prepared by a cook and served directly to consumers, the costumer's table or in a buffet. In contrast, when processed food is sent to retail, the cooking process happens at people's houses, and it is later eaten at home by home consumers.
Sample Answer :
The pie charts show the sports with the most popularity among French secondary schools in 1990, 2000 and 2010.
Overall, swimming was the most favored sport in the three years compared, whereas tennis had the least popularity. Basketball replaced the ‘other' category to become the second most-favored sport in the final year.
Swimming was most popular among French secondary pupils in the three years, with 39%, 48% and 41% for 1990, 2000 and 2010, respectively. In contrast, despite of an increase in popularity in 2010, tennis was the least favored sport in each year, with 4% in both 1990 and 2000, and 7% in 2010.
Basketball's popularity had experienced a noticeable drop in 2000, from 16% to only 7%, before it rose substantially to 25% in the last year, replacing ‘other' to become the second favorite. The ‘other' category was the preferred sport after swimming in 1990 and 2000, with 25% and 23%, but its popularity dropped to 19% in 2010. The popularity of football remained among the lower ones in the three years, with 16%, 18% and 8% for 1990, 2000 and 2010, respectively.
Your Answer
Total words: 0
Grammar Errors: 0
Spelling Errors: 0
IELTS Writing Task 1 practice helps candidates improve their ability to describe graphs, charts, maps, tables, and diagrams effectively. Regular practice builds vocabulary, enhances data analysis skills, and teaches proper answer structure. By attempting different question types, students can gain confidence, improve time management, and achieve a higher IELTS band score.
Approximate Time Required |
Minimum Word Count |
|---|---|
|
20 Minutes |
150 |
Explore all the types of diagrams that might appear in your exam.
A line graph shows trends or changes over time. In IELTS writing task 1 practice, students often describe increases, decreases, and fluctuations shown by one or more lines.
A bar chart compares different categories using bars. Candidates need to highlight major differences, similarities, and key figures in the data.
A pie chart displays percentages or proportions of a whole. In IELTS writing task 1, you should compare sections and identify the largest and smallest parts.
A table presents data in rows and columns. The task requires summarizing important information and comparing key numbers without listing every detail.
A process diagram explains how something works or is produced step by step. In an IELTS writing task 1 practice test, candidates should describe the stages in a logical sequence.
A map shows changes in a location or compares places. You need to describe developments, new features, and major transformations accurately.
Before writing your answer, spend a few minutes analyzing the chart, graph, table, or diagram carefully. In IELTS writing task 1, understanding the main trends, comparisons, and important figures helps you create a more organized and accurate response without missing key details during the exam. You can also improve your preparation with a free IELTS online test to practice under real exam conditions.
A clear overview is one of the most important parts of IELTS writing task 1 practice. Instead of listing every number, summarize the major trends and key changes. Examiners want to see whether you can identify the overall picture and present information in a logical manner.
During your IELTS writing practice test, focus on improving vocabulary for describing increases, decreases, comparisons, and trends. Avoid repeating the same words multiple times. Using varied and accurate vocabulary naturally can improve readability and help create a stronger impression on examiners.
Many students write overly complicated sentences that lead to grammar mistakes. In IELTS writing task 1, accuracy matters more than complexity. Practice writing clear and grammatically correct sentences so your ideas are easy to understand and your response looks more professional and polished overall.
Time management plays an important role in every IELTS writing task 1 practice session. Train yourself to complete the report within twenty minutes. Regular timed practice helps improve writing speed, boosts confidence, and prepares you to manage pressure effectively during the actual IELTS examination.
Reading high-scoring sample responses is a smart way to improve IELTS writing task 1 skills. Compare your structure, vocabulary, grammar, and organization with band-level answers. Start with Gurully to explore expert examples, understand your mistakes, and improve your writing performance more consistently.
To improve your IELTS Writing Task 1 score, focus on understanding chart trends, organizing information clearly, and using accurate grammar and vocabulary. Practice writing introductions, overviews, and comparisons regularly. You should also learn how to identify key features instead of describing every detail in the graph or chart.
Practice with real exam questions
Blank answer cannot be submitted, Kindly Re-attempt!
Time is completed