

IELTS writing task one is the first question type of the writing section. Even though the task is simple, some students find it difficult to attempt because of a lack of understanding and preparation. But IELTS writing task 1 (Academic) is not about creative writing; instead, it is about presenting the information in a structured way.
To understand how this task will appear in a real exam, take an IELTS free online test and check your proficiency. It will help you understand where you are lacking and what needs improvement.
What is IELTS Writing Task 1 (Academic)?
In this task, you will see visual information in diagram format, and you have to explain it in your own words by writing. Depending on the IELTS writing task 1 topics, you might have to describe trends, compare figures, explain differences, summarize changes, etc. For example:
The question concerns a graph showing fuel price changes over the years. Please focus on the major increases, decreases, and comparisons rather than every small detail.
- Word Limit – Minimum 150 words
- Types of visuals- bar chart, line graph, table, pie chart, process diagram, map
- Time Limit- 20 minutes
Make sure you write a minimum of 150 words because descriptions shorter than this will be penalized.
How the Writing Task 1 Score is Calculated
Your report is marked using four different areas. Each one contributes equally to the final band score.
Task Achievement-
This checks whether the response answers the question properly. The examiner looks for:
- Accurate information about the data
- Describing all the elements of a chart or diagram.
- Clearly explaining the features.
- Relevant comparison
If you miss the trend of the diagram, you will lose scores.

Cohesion and Coherence:
In this part, your response is evaluated on the basis of the readability of the organization. A strong response usually:
- Has clear paragraphs
- Connects ideas smoothly
- Uses linking words naturally
- Follows a logical sequence
Words like “however,” “meanwhile,” “similarly,” and “overall” help improve flow when used correctly.
Lexical Resource:
This criterion checks vocabulary range. Instead of repeating the same words, stronger answers use different expressions such as:
- Climbed steadily
- Dropped sharply
- Remained unchanged
- Witnessed growth
- Showed a slight decline
- Fluctuated over time
The goal is not difficult vocabulary. The goal is accurate vocabulary.
Grammatical Range and Accuracy
In this part, your answer is evaluated on the basis of:
- Variety of sentences
- Correct grammar usage
- Accurate punctuations
- Usage of correct tenses
Grammatical mistakes can decrease the clarity of sentences, resulting in an overall band score.
High Scoring Tips For IELTS Writing Task 1
First, understand the Visual before Starting to Write:
As the time is limit but you should not start writing immediately, instead spend a few minutes identifying:
- The biggest trend
- The highest and lowest points
- Similarities or differences
- Important changes
This makes the report more organized.
Include an Overview:
An overview is essential in Task 1. This section should briefly explain:
- The overall trend
- The most noticeable feature
- Major changes in the chart
A missing overview often affects higher band scores.
Compare Information Smartly:
Good answers compare information instead of simply listing numbers. For example:
- “Car sales increased faster in Europe than in Asia.”
- “The percentage for adults remained lower throughout the period.”
This style sounds more analytical and natural.
Keep the Language Formal:
IELTS Academic Writing requires formal tone. Avoid phrases like:
- I think
- I believe
- According to me
Task 1 is a report, not an opinion essay.
Watch Your Time
Candidates sometimes spend too much time on Task 1 and rush Task 2 later. A balanced approach can help:
- 4–5 minutes planning
- Around 12 minutes writing
- Last few minutes proofreading
Checking spelling and grammar at the end can prevent unnecessary mistakes.
Simple IELTS Writing Task 1 Template
Introduction
- Rewrite the question in your own words.
- Example:
- The chart presents information about changes in public transport usage between 2015 and 2025.
Overview
- Mention the main trend briefly.
- Example:
- Overall, public transport usage increased during the period, while private vehicle usage declined slightly.
Body Paragraph 1
Focus on:
- Main details
- Important comparisons
- Key figures
Body Paragraph 2
Add:
- Remaining information
- Additional trends
- Noticeable differences
Things to check before finally submitting the Answer:
- Minimum word count 150 words
- Usage of full sentences only.
- Club similar information together.
- Eliminate unnecessary information.
- Grammar check
IELTS Writing Task 1 Sample Question with Answers:
IELTS writing task 1 sample 1:
IELTS writing task 1 sample Answer:
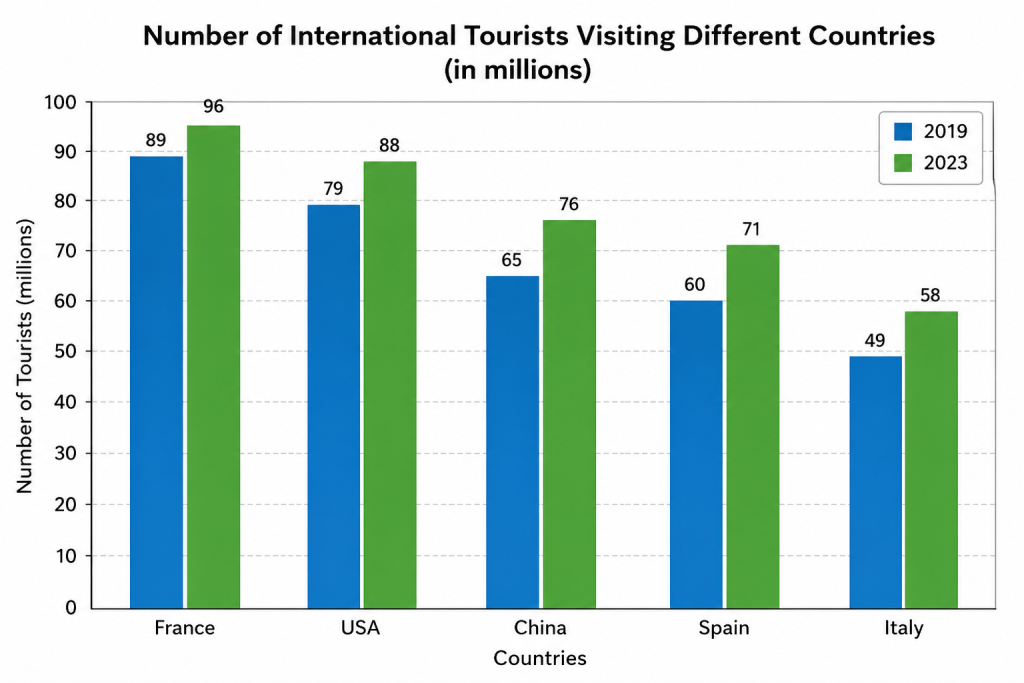
The bar chart compares the number of international tourists visiting five countries—France, the USA, China, Spain, and Italy—in 2019 and 2023, measured in millions.
Overall, all five countries experienced an increase in the number of international visitors between the two years. France remained the most popular tourist destination in both 2019 and 2023, while Italy attracted the fewest tourists throughout the period.
In 2019, France welcomed 89 million tourists, the highest figure among the countries shown. The USA ranked second with 79 million visitors, followed by China at 65 million. Spain received 60 million tourists, whereas Italy had the lowest number at 49 million.
By 2023, tourist arrivals had risen noticeably in every country. France saw an increase to 96 million visitors, maintaining its leading position. The USA also experienced significant growth, reaching 88 million tourists. China recorded a considerable rise from 65 million to 76 million, while Spain’s figure climbed to 71 million. Italy, despite remaining the least visited country on the chart, still showed growth, with tourist numbers increasing to 58 million.
In conclusion, the chart illustrates a clear upward trend in international tourism across all five nations over the four-year period.
IELTS writing task 1 sample 2:
IELTS writing task 1 sample Answer:
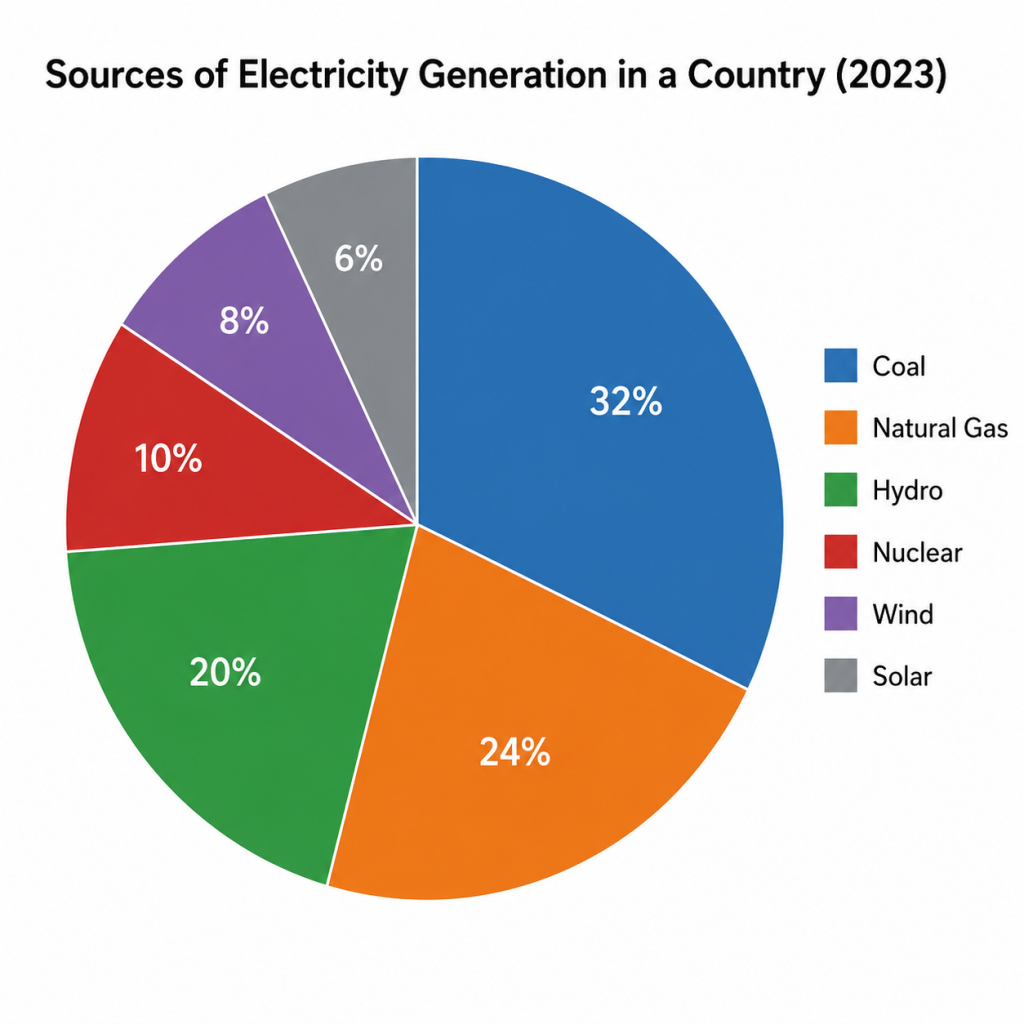
The pie chart illustrates the proportions of electricity generated from six different energy sources in a country in 2023.
Overall, fossil fuels were the dominant sources of electricity production, with coal and natural gas together accounting for more than half of the total generation. In contrast, renewable energy sources such as wind and solar contributed relatively smaller shares.
Coal was the largest single source of electricity, making up 32% of the total production. Natural gas was the second most significant contributor at 24%. Together, these two conventional energy sources supplied 56% of the country’s electricity, showing a heavy dependence on fossil fuels.
Among the renewable sources, hydro power accounted for 20% of electricity generation, making it the third-largest contributor overall. Wind energy represented 8%, while solar power contributed the smallest proportion at only 6%. Although these figures were lower compared to coal and natural gas, they still formed an important part of the country’s energy mix.
Nuclear energy generated 10% of the electricity, placing it between hydro power and wind energy in terms of contribution. Overall, the chart indicates that traditional energy sources remained the primary means of electricity generation in 2023, despite the growing role of renewable energy sources.

IELTS writing task 1 sample 3:
IELTS writing task 1 sample Answer:
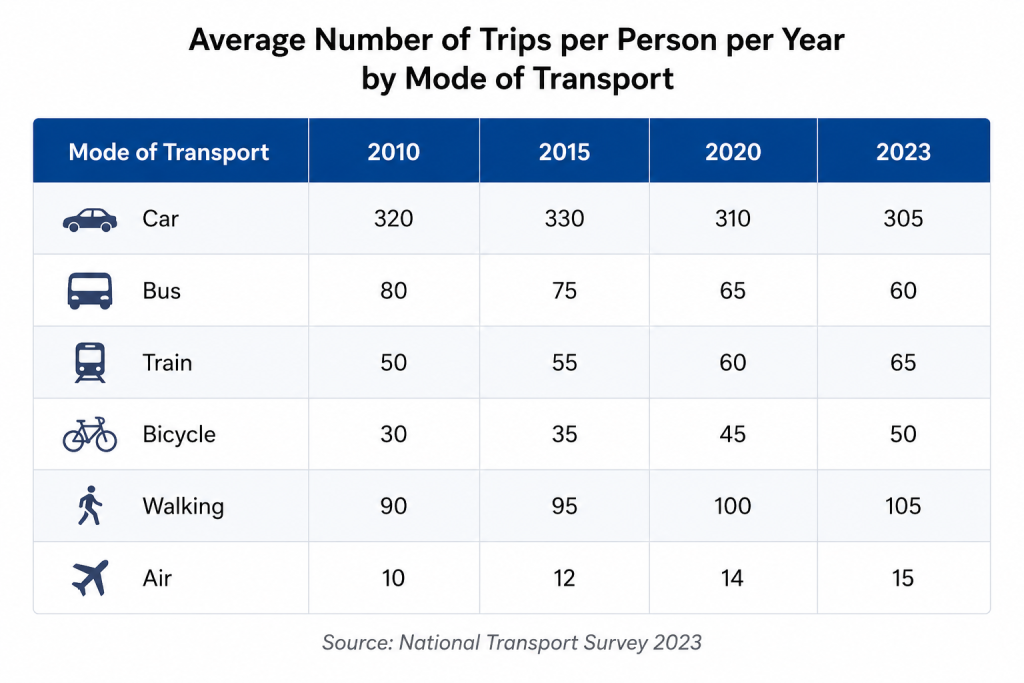
The table illustrates the average number of trips made per person each year using six different modes of transport between 2010 and 2023.
Overall, travelling by car remained the most common form of transportation throughout the period, despite a slight decline after 2015. In contrast, the use of trains, bicycles, walking, and air travel gradually increased over time, while bus travel became less popular.
In 2010, people made an average of 320 trips by car annually, which was significantly higher than any other mode of transport. This figure rose slightly to 330 trips in 2015 before falling to 310 in 2020 and 305 in 2023. Bus travel followed an opposite trend, declining steadily from 80 trips in 2010 to just 60 in 2023.
On the other hand, train travel became increasingly common during the period. The average number of train trips increased from 50 in 2010 to 65 in 2023. Bicycle use also showed considerable growth, rising from 30 trips to 50 over the same years. Similarly, walking became more frequent, increasing gradually from 90 to 105 trips per person annually.
Air travel remained the least used form of transport throughout the period. However, it still experienced a small but steady increase, climbing from 10 trips in 2010 to 15 in 2023.
In conclusion, the table suggests a gradual shift away from traditional road-based public transport, particularly buses, towards more sustainable and active forms of transportation such as cycling, walking, and train travel.
IELTS writing task 1 sample 4:
IELTS writing task 1 sample Answer:
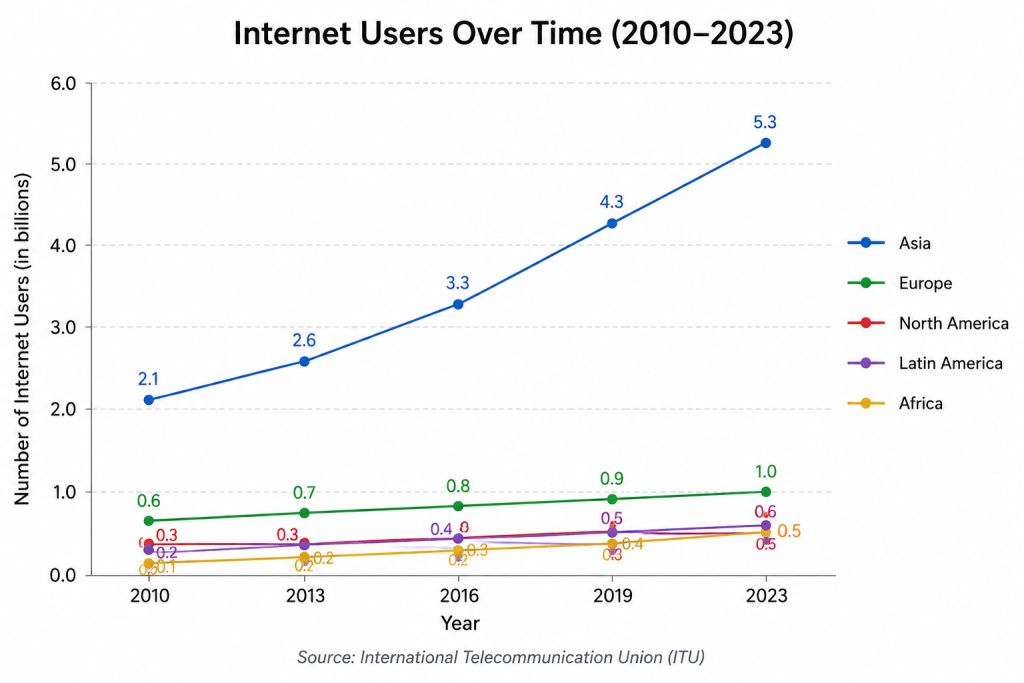
The line graph illustrates the number of internet users, measured in billions, across five regions—Asia, Europe, North America, Latin America, and Africa—between 2010 and 2023.
Overall, internet usage increased steadily in all regions during the period. Asia consistently had by far the largest number of internet users, while Africa remained the region with the lowest figures despite noticeable growth over time.
In 2010, Asia recorded approximately 2.1 billion internet users, far ahead of Europe at 0.6 billion. North America and Latin America had relatively similar figures, at around 0.3 billion and 0.2 billion, respectively, while Africa had the fewest users at only 0.1 billion.
Over the following years, internet usage rose significantly across all regions. Asia experienced the most dramatic increase, climbing from 2.1 billion users in 2010 to 5.3 billion in 2023. Europe also showed steady growth, reaching 1.0 billion users by the end of the period.
Meanwhile, North America grew more gradually, rising from 0.3 billion to 0.5 billion users. Latin America followed a similar upward trend, increasing from 0.2 billion to 0.6 billion. Africa, although still the smallest market, saw its number of internet users rise fivefold, from 0.1 billion in 2010 to 0.5 billion in 2023.
In conclusion, the graph demonstrates a continuous global expansion in internet usage, with Asia dominating throughout the period and developing regions such as Africa and Latin America showing substantial progress.
IELTS writing task 1 sample 5:
IELTS writing task 1 sample Answer:
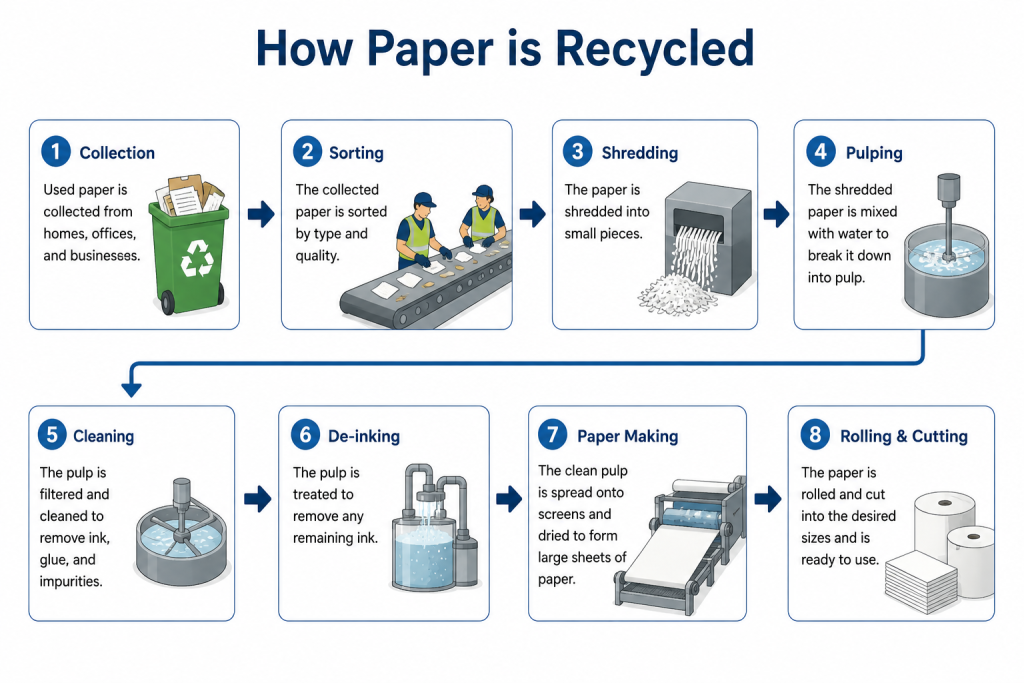
The diagram illustrates the process of recycling paper, showing the various stages involved from collection to the production of new paper products.
Overall, the recycling process consists of eight main steps, beginning with the collection of used paper and ending with rolling and cutting the finished paper into usable sizes. The procedure involves several stages of treatment and cleaning before new paper is finally produced.
In the first stage, used paper is collected from homes, offices, and businesses. After collection, the paper is sorted according to its type and quality to ensure that suitable materials are selected for recycling. The sorted paper is then shredded into small pieces using industrial machines.
Next, the shredded paper is mixed with water in a process known as pulping. This step breaks the paper down into a soft pulp mixture. Following this, the pulp undergoes a cleaning stage in which impurities such as glue, dirt, and remaining particles are removed through filtering.
The sixth stage is de-inking, where special treatments are applied to eliminate any leftover ink from the pulp. Once the pulp becomes clean and refined, it is spread onto screens and dried to form large sheets of paper during the paper-making stage.
Finally, the newly produced paper is rolled and cut into different sizes according to requirements, making it ready for use again. Overall, the process demonstrates how waste paper can be transformed into reusable paper products through a systematic recycling procedure.
Scoring high in exams requires more than just practicing sample questions. To truly understand the exam pattern and build confidence, visit Gurully and practice with our expert-curated full-length mock tests. These tests are designed to make you exam-ready by giving you a real exam-like experience. If you want to improve specific areas, you can also do section-wise practice on Gurully to strengthen individual sections effectively.
FAQ:
How to get 8.5 in IELTS Writing?
Is a 7.5 IELTS score easy?
What is 27 out of 40 in IELTS Reading?
Is 4.5 fail in IELTS?
Is band 6 a pass?
Also Read:
- Know All About IELTS Full Form, Format & Mode
- Most Repeated IELTS Speaking Topic for 2026
- Most Repeated IELTS Essay Topics For 2026