

If you’ve ever practiced for the PTE exam, you probably know the Describe Image section. And let’s be honest—most students are comfortable with bar graphs or pie charts. But the moment a PTE process chart pops up, things feel a bit more complicated. Instead of numbers or percentages, you’re staring at steps, arrows, and stages that connect in ways you might not know how to explain.
But no worries, you can easily explain this through expert practice tips. Once you learn a simple way to structure your response, this task is nowhere near as scary as it looks.
PTE Process Chart/Flow Chart Task:
During the Speaking section, the computer flashes an image on your screen. It could be anything—a table, a diagram, or a flow chart. You’ll have 25 seconds to think and then 40 seconds to speak once the mic turns on. Flow charts usually show a step-by-step journey.
For instance, you might get one about:
- How water cycles through nature
- A company’s hiring process
- Different stages in a manufacturing cycle
Your job isn’t to explain every single detail. Instead, you just need to give a short, clear overview of how the steps connect. Think of it as telling a friend how something works, without diving into technical jargon.
Start your free PTE mock test with Gurully and get AI-powered analysis for a personalized journey.
- Kickstart your PTE prep with a free AI-scored mock test
- Boost your score with in-depth analysis & smart recommendations
Scoring in PTE Process Chart/Flow Chart :
The Describe Image task isn’t just about content. The scoring system is looking at:
- Fluency – Are you speaking smoothly, or stopping too much?
- Pronunciation – Do your words sound clear and easy to catch? )
- Content – Did you at least mention the main idea and stages?
Doing well here is like hitting three targets with one arrow. It improves your overall Speaking score more than you might think.
PTE Process Chart / Flow Chart Template:
Introduction (What the chart is about):
- “This flow chart shows the process of [topic], explaining how [end result/outcome] is achieved.”
Overview (Main idea):
- “The chart is divided into several stages, starting from [first step] and ending with [final step]. Each stage is connected and follows a logical sequence.”
Details (Step-by-step explanation):
- “First, [describe step 1 briefly].”
- “Next, [describe step 2].”
- “After that, [describe step 3].”
- “Finally, the process ends with [last step].”
Conclusion (Summary line):
- “Overall, the chart highlights a clear step-by-step process that shows how [final outcome] is completed.”

Tips To Score High In PTE Process Chart:
Look for the Big Idea
- Don’t waste time on tiny arrows or side notes. Ask yourself: What’s this chart really about? That’s your starting line.
Use Connecting Words
- Words like first, next, then, finally keep your explanation smooth. They also help you avoid those long “umm…” pauses.
Keep It Straightforward
- You don’t get extra marks for big words. Saying “The process begins with… and ends with…” is perfectly fine if you sound confident.
Watch the Clock
- Forty seconds pass quickly. Try to aim for five or six sentences, not more.
Don’t Freeze
- Forget one step? Just skip it and move forward. Pausing too long is worse than missing a detail.
Focus on Clarity
- Words like cycle, sequence, outcome, or development are common in flow charts. Practice saying them clearly.
Give a Conclusion:
- In the end, always conclude the ending line. For example, you can say – ‘Overall, the chart highlights the stages involved in photosynthesis.”
The Best Way to Practice
- Record Yourself: It is very important to practice by recording yourself. Speak for 40 seconds and check where you are wrong.
- Take Mock Tests: It is very important to do question-wise practice and take PTE practice mock test. You can also take individual section-wise test.
PTE Describe Image Process Chart Sample Questions With Answer
Process Chart Sample Questions 1:
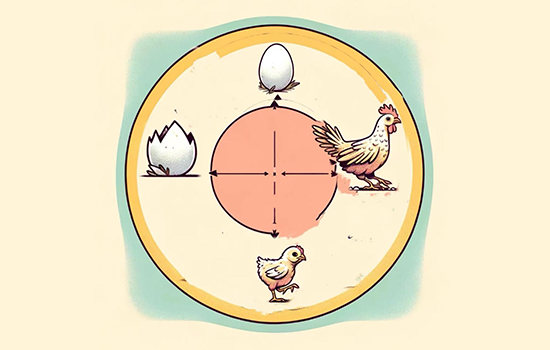
Description:
This image illustrates the life cycle of a chicken. It starts with an egg, which hatches into a chick. The chick grows into a young chicken and eventually becomes an adult hen. The adult lays eggs, and the cycle repeats. This diagram visually represents the stages of growth in poultry farming.
Process Chart Sample Questions 2:
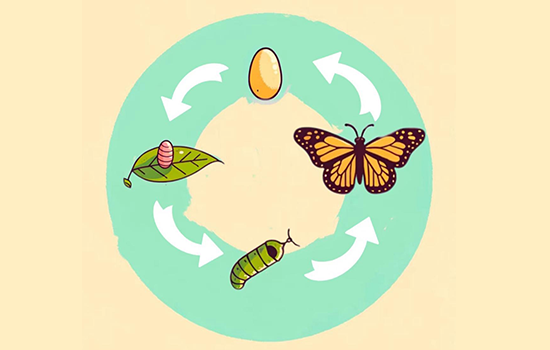
Description:
The image displays the four stages of a butterfly’s life cycle. It begins with an egg, which hatches into a caterpillar. The caterpillar then forms a pupa or chrysalis, undergoing metamorphosis. Finally, it emerges as a butterfly, completing the cycle. This process is crucial in insect development.
Process Chart Sample Questions 3:
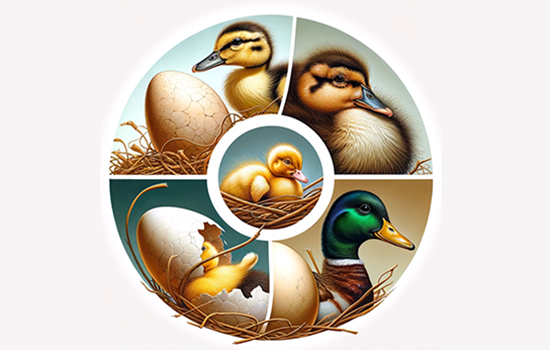
Description:
This diagram highlights the development of a duck from an egg to an adult. The cycle starts with an egg, which hatches into a duckling. The duckling grows, developing feathers and maturing into an adult duck. The adult then lays eggs, ensuring the continuity of the species.
Process Chart Sample Questions 4:
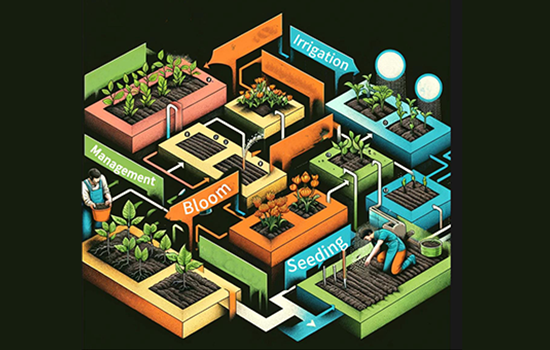
Description:
This image represents different stages of plant growth and farming management. It includes seeding, irrigation, blooming, and overall crop management. The interconnected blocks indicate systematic agricultural practices. It highlights the importance of structured farming techniques for healthy plant development.
Process Chart Sample Questions 5:
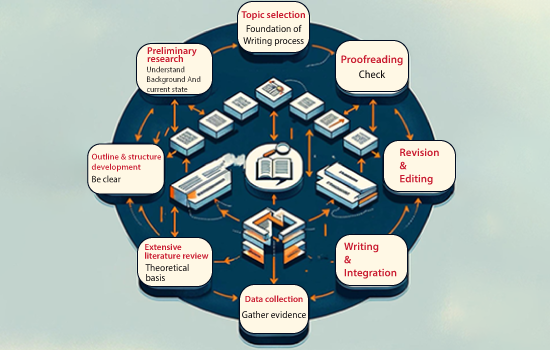
Description:
The image illustrates the writing process, starting with topic selection as the foundation. It progresses through preliminary research, extensive literature review, and data collection. The next stages include outlining, writing, and integration, followed by revision and editing. Finally, proofreading ensures accuracy before the document is completed.
Process Chart Sample Questions 6:
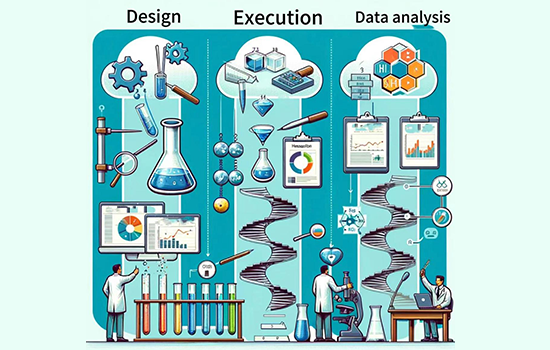
Description:
The visual outlines the scientific research process, divided into design, execution, and data analysis. The design phase involves hypothesis formulation and experiment setup. Execution includes lab work and testing, while data analysis interprets results through statistical tools. This structured approach ensures scientific accuracy.
Process Chart Sample Questions 7:
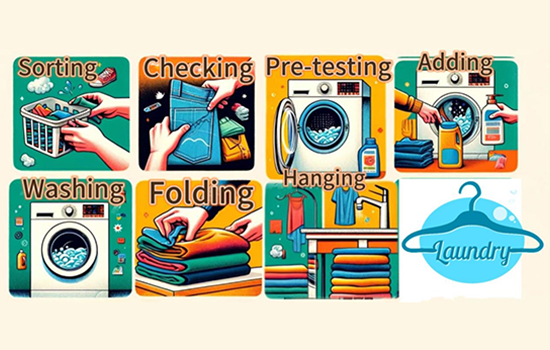
Description:
This illustration details the laundry process, beginning with sorting clothes. It progresses to checking for stains, pre-testing detergents, and adding cleaning agents. The next stages include washing, folding, and hanging clothes. The final step ensures fresh, neatly arranged laundry.
Process Chart Sample Questions 8:
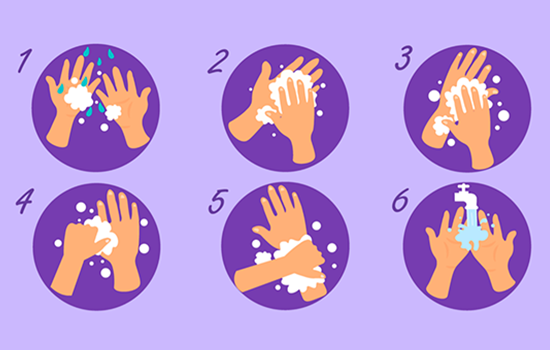
Description:
The image presents a visual guide to effective handwashing, a critical practice for maintaining personal hygiene. It begins with applying soap from a dispenser, followed by thoroughly scrubbing hands, ensuring all areas are covered. The process continues with a rinse under running water and concludes with drying hands using a clean towel or air dryer, completing the sanitation cycle.
Process Chart Sample Questions 9:
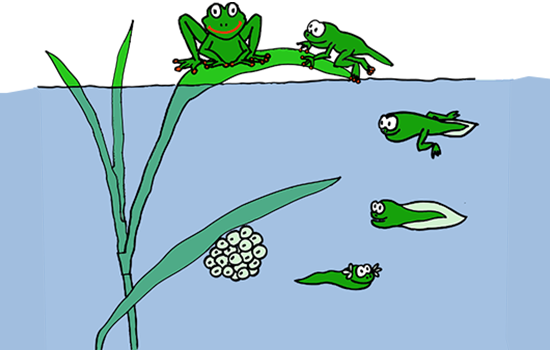
Description:
This illustration captures the fascinating transformation of a frog from its earliest stage to adulthood. It starts with eggs laid in water, which soon hatch into tadpoles. These tadpoles then develop into froglets and eventually mature into adult frogs, ready to reproduce and continue the cycle of life.
Process Chart Sample Questions 10:
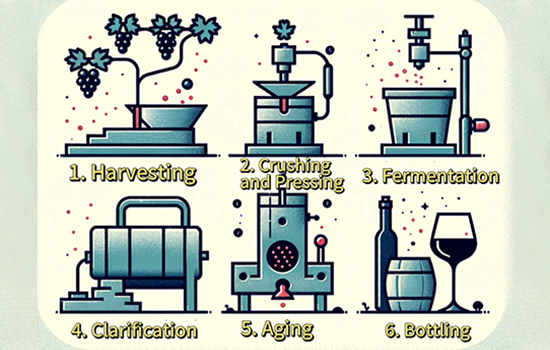
Description:
The image details the intricate process of wine production, starting with the harvesting of grapes. It proceeds to the crushing and pressing of the grapes, followed by fermentation, clarification, aging, and bottling. Each stage is crucial in crafting a bottle of wine, reflecting the art and science involved in viticulture.
Not Sure Where to Start ? Start Now with Practicing Questions
- Al scored practice questions
- 30000+ practice questions with Al Scoring
- Practice with predictive questions
Start Speaking Practice
Time: 35-40 Minutes
Questions: 32 questions
Difficulty Level: PTE Exam Level
Practice more of these questions for free through Gurully’s question-wise practice. You also get a full-length mock test crafted by exam experts. Explore section-wise tests, helpful templates, and a vocabulary guide. With detailed performance analysis of every task, you’ll clearly see your strengths and weaknesses, making your preparation more effective and focused. For more PTE updates, keep visiting Gurully.com
FAQ:
How to get 70 in PTE Speaking?
How much is 7.5 in PTE?
Is PTE checked by AI?
Is the PTE exam 2 hours or 3 hours?
Is 1 month enough for PTE?
Also Read:
- Gurully vs ApeUni: Which PTE Platform is Best for You?
- Gurully vs Alfa PTE: Who Scores More Accurately in Mock Tests?