
The PTE exam is easy to crack if you have the proper techniques and template to tackle each question type. In the scoring algorithm your vocabulary, language skills, pronunciation, and oral fluency will be evaluated in this PTE Describe image task. question. In this blog, we will explain everything about PTE describe image template, scoring, and sample questions and answers for practice. These describe image PTE tips and templates can also be used while practicing on a PTE mock test to boost your score.
Let’s start with understanding the format.
Number of questions – 5-6
Negative marketing – No
Time to answer per question – Around 30-40 seconds
Preparation time: 25 Seconds
Type of images in PTE exam – In this section, the test taker has to describe various images, including pie charts, Bar graphs, Maps, Photos, Mixed type images, System diagrams, Line graphs, Process Diagrams, and Tables.
PTE Describe Image Template
The image provided is a [any type of image] that illustrates [main topic or subject of the image].
2. Key Features:
- The most prominent feature is [describe the most noticeable trend, value, or feature].
- Another significant observation is [describe a secondary trend, value, or detail].
- It also shows [additional detail or pattern].
There appears to be a relationship between [describe any correlation or comparison, e.g., increasing trends, contrasting elements]. For example, [explain briefly].
4. Conclusion:
Overall, the image provides valuable insights into [summarize the key insight, trend, or overall pattern].

Scoring for PTE Describe Image
In the PTE Speaking section, you will be scored depending on how well you have described the key information of the image. The general scoring scheme for this section is as follows:
Content:
| Score | Description |
| 6 | You described the picture really well, covering all parts and how they connect. Your words sounded natural and clear. Anyone listening could imagine the whole picture without seeing it. |
| 5 | You explained the main things in the image and mentioned some connections, but didn’t go into much detail. Your vocabulary was good. A listener could still imagine most of the picture. |
| 4 | You mentioned a few correct points but missed some important parts or didn’t explain how things are connected. Your vocabulary was simple and a bit repetitive. The listener would understand the basic idea, but not the full image. |
| 3 | You gave only basic details and made a few mistakes. You used the same simple words again and again. The listener might get parts of the picture but not the full idea. |
| 2 | You said very little and weren’t very accurate. Your words were too simple, and the explanation was weak. It would be hard for someone to picture the image based on what you said. |
| 1 | Your answer was just a disconnected list of points with no explanation. Vocabulary was very poor and lacked structure. The listener would find it hard to understand or visualise the image. |
| 0 | The answer was too short, vague, or incomplete to be scored—even if it was on topic. |
Scoring for Pronunciation & Oral Fluency:
| Score | Pronunciation | Oral Fluency | |
| 5 | Highly clear: Vowels and consonants are correctly pronounced. Stress is accurate in all words and sentences. | Smooth rhythm and phrasing, no hesitations or false starts. | |
| 4 | Clear pronunciation with minor errors. Words are easy to understand. Stress is placed correctly. | Acceptable rhythm and phrasing, with one hesitation or repetition. | |
| 3 | Most vowels and consonants are correct, but a few words might be unclear. | Speech is mostly continuous, but uneven with some hesitations or repetitions. | |
| 2 | Some consonants and vowels are mispronounced. Listeners may need to adjust to the accent. | Speech may be uneven or staccato with a few hesitations and repetitions. | |
| 1 | Many vowels and consonants are mispronounced, making it hard to understand parts of speech. | Speech lacks rhythm, with many hesitations, repetitions, and pauses. | |
| 0 | Pronunciation may be completely incorrect, making speech unintelligible. | Speech is very slow, with frequent pauses and significant issues in fluency. |
50 PTE Describe Image Examples with Answers
Example 1
Sample Answer
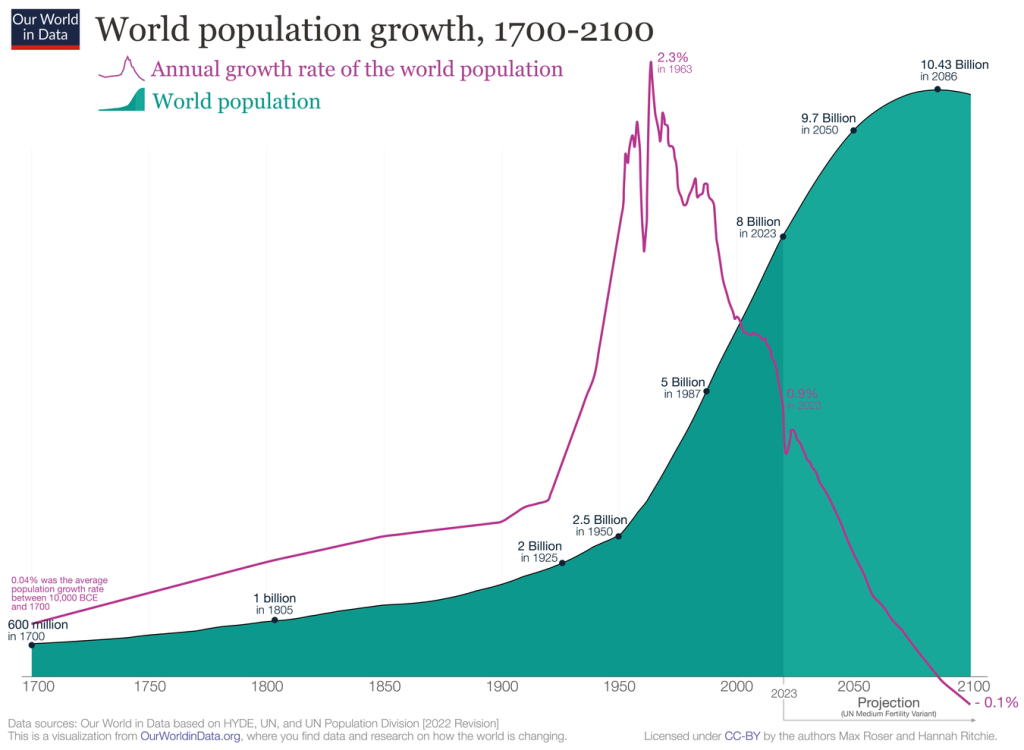
The graph illustrates the changing time it took for the world’s population to double throughout history. Initially, population growth was slow, with doubling times spanning centuries. However, from the mid-20th century, growth accelerated dramatically, with the population doubling in just over three decades. Since then, the rate has slowed, and projections indicate a gradual return to longer doubling times by the end of the century.
Example 2
Sample Answer
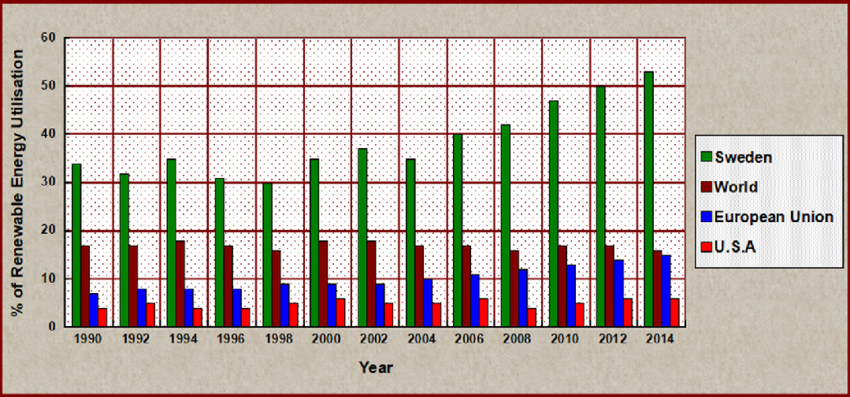
The bar graph compares the percentage of renewable energy consumption across several countries. It is evident that there is a significant disparity in the utilization of renewable energy sources among these nations. Sweden exhibits the highest percentage of renewable energy consumption, followed by the rest of the world. In contrast, The European Union and the USA have considerably lower percentages. The graph highlights the need for increased adoption of renewable energy sources globally.
Example 3
Sample Answer
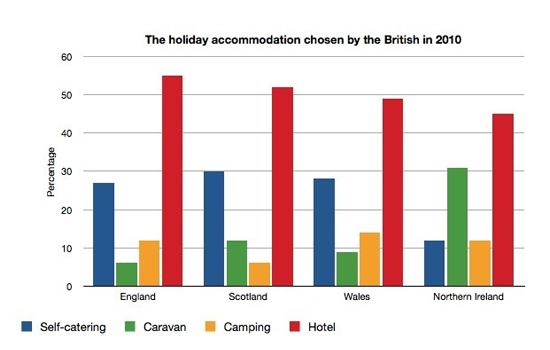
The bar graph represents the holiday accommodation chosen in 4 categories: self-catering, caravan, camping, and hotel by British in 2010. In all four destinations, England, Scotland, Wales, and Northern Ireland, most people chose to stay in a hotel, with more than 40 percent for every country. At the same time, the lowest number of people chose a caravan in England, which was only 5%. Most people prefer to stay in Hotels rather than any other accommodation.
Example 4
Sample Answer
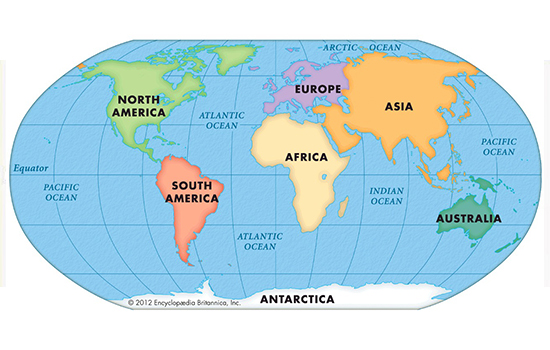
The given image represents the distribution of continents around the globe. It can be seen from the image that the globe is divided into seven continents: North America, Europe, Asia, Africa, and many more. Furthermore, Asia is the biggest continent in terms of area, shown in orange. At the same time, Australia is the smallest continent of all, shown in green. Overall, the maximum area is covered by water around the globe.
Example 5
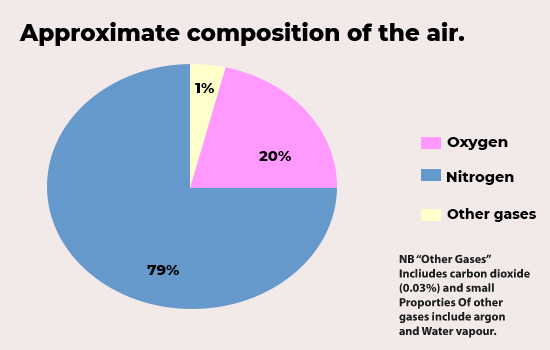
Sample Answer
This Pie chart represents the composition of the air in approximation. It can be seen that the air is mostly composed of Nitrogen by nearly 80%. On the other hand, the percentage of oxygen in the air is only 20%. While 1% of other gases also contribute to the composition of air. Overall, the air is mainly composed of nitrogen gas.
Example 6
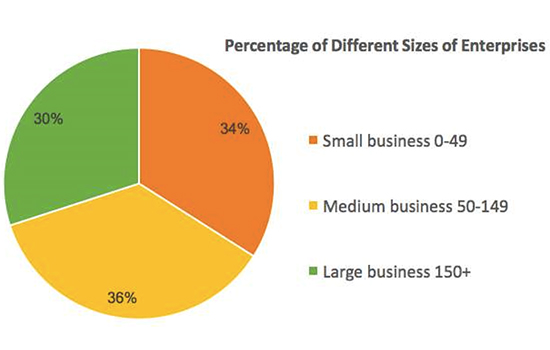
Sample Answer
This pie chart represents the percentage distribution of different sizes of small, medium and large businesses. It can be seen that the medium business owned the maximum percentage of the enterprise was 36%. At the same time, the minimum percentage was for large businesses, at 30%. Furthermore, the percentage for small businesses was 34%. Overall, there was only a marginal difference in the sizes of enterprises.
Example 7
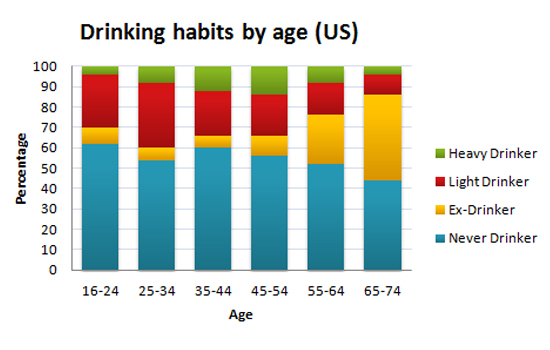
Sample Answer
This bar graph depicts the percentage of drinking habits by age in the US. It can be seen that the highest percentage in every age group were never drinkers, with a maximum of 62% in the age group between 16 and 24. While the ratio of heavy drinkers was least with only 5% for the 65-74 age group. Overall, there was a vast difference between the percentage of heavy drinkers and never drinkers.
Example 8
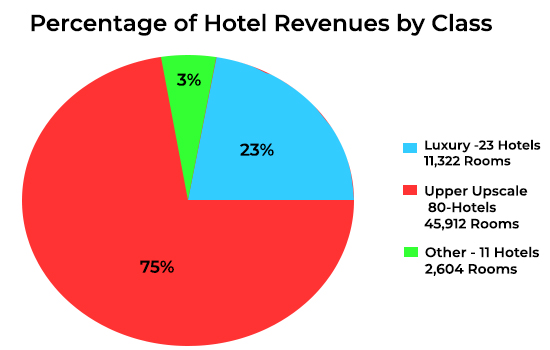
Sample Answer
The pie chart represents the percentage of Hotel revenues by class, such as luxury, upper-upscale, and others for several hotels. It can be seen that precisely 75% of the revenue was generated from 80 upper-upscale hotels, which had 45912 rooms. On the other hand, only 23 percent of income came from 23 luxury hotels. Overall, a large sum of revenue originated from upper-upscale hotels.
Example 9
Sample Answer
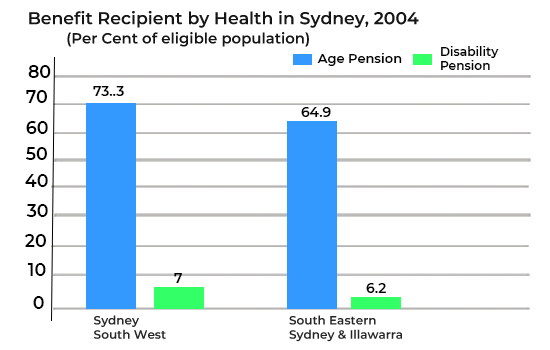
This bar graph represents the percentage of benefitted eligible pension recipients by Health Area in Sydney in 2004. It can be seen that more than 73 percent of the population was entitled to get the age pension in Sydney Southwest. In contrast, only 7 percent of people were eligible for disability pension. And the figures stood almost the same at Southeastern Sydney and Illawarra. Overall, the percentage of eligible age pension beneficiaries was remarkably higher than the percentage receiver of disability pensioners.
Example 10
Sample Answer
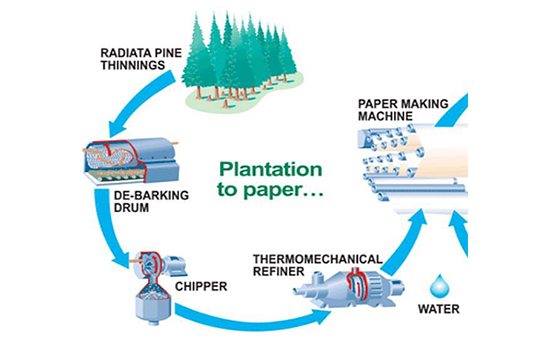
The picture shows information about the plantation on paper. It can be seen from the picture that trees have to go through the debarking drum, chipper, Thermomechanical refiner, and paper-making machine to finally convert from trees to paper. Overall, there are several stages to convert a tree into a bundle of paper.
Example 11
Sample Answer
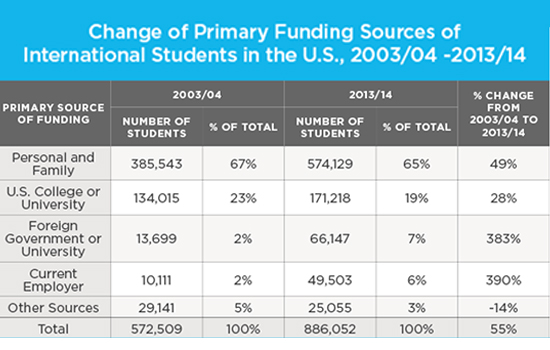
This table represents a change in primary funding for international students from various funding sources in the U.S. from 2003-2004 to 2013-2014. It can be seen that financing for personal and family was 385,543, which rose to 574,129 in 2013-14. On the other hand, foreign governments and current employers funded only 2% of students in 2003\/04, which increased by nearly 4% in 2013\/14. There was a drastic increase in the number of students receiving funds, except for the other sources.
Example 12
Sample Answer
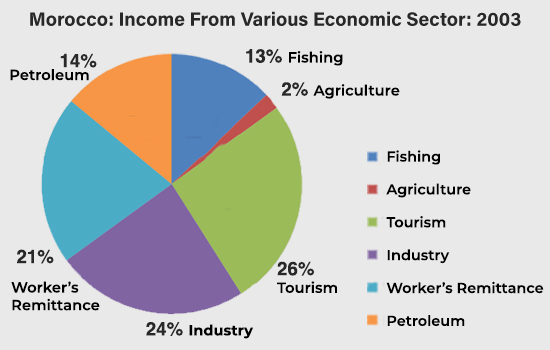
The pie chart represents Morocco’s income from various economic sectors for 2003. It can be seen that the various economic sectors listed here are Fishing, Agriculture, Petroleum, workers’ Remittances, Industry, and Tourism. Furthermore, Morocco’s maximum income was from Tourism, i.e., 26%. The minimum percentage of income obtained was from agriculture, which was 2%. Overall, it can be concluded that Morocco has more tourist attractions Places.
Example 13
Sample Answer
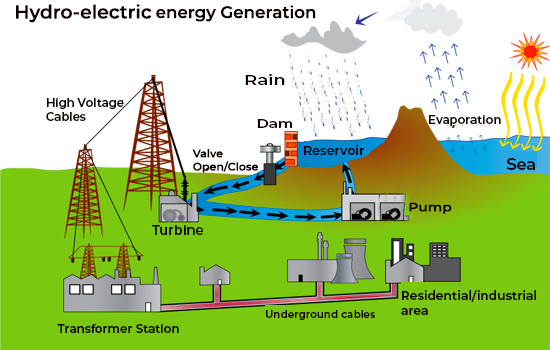
This diagram shows the process of hydroelectric power generation. The process starts with the evaporation of seawater, which is followed by the collection of rainwater in reservoirs and dams. After that, with the help of a pump and turbine, the electricity is generated and passed through high voltage cables to the transformer stations. Finally, with the help of underground wires, hydroelectric energy is distributed to the residential and industrial areas. Overall, several stages are involved in the electric production of seawater.
Example 14
Sample Answer
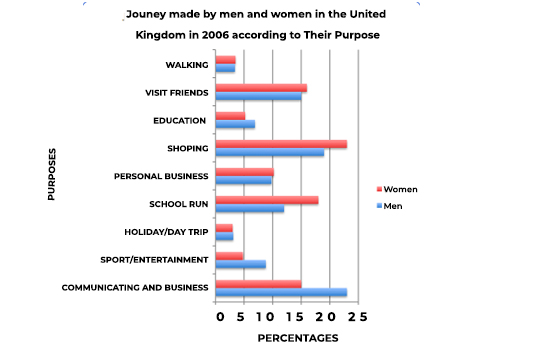
The bar graph represents the percentage of men and women who made journeys in the United Kingdom in 2006 for various purposes like commuting and business, shopping and walking. It can be seen that for men, the maximum percentage of the journey was done for commuting and business, which was around 24%, and this ratio stood the same for women, but the purpose was shopping. On the other hand, only 4% of the journeys were made for walking and holiday trips by both men and women. Overall, the main reasons were commuting, business, and shopping for both men and women.
Example 15
Sample Answer
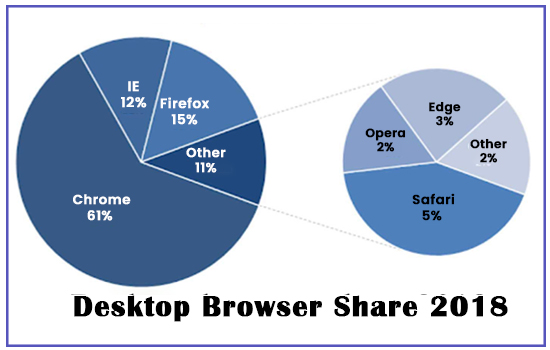
The Pie chart here represents the desktop browser share for the year 2018. Various browsers like Chrome, Internet Explorer, Firefox, and other categories are listed here. It can be seen that the maximum number of users, i.e., 61 %, preferred Google Chrome. Firefox is observed to be the second most popular after Chrome.
Example 16
Sample Answer
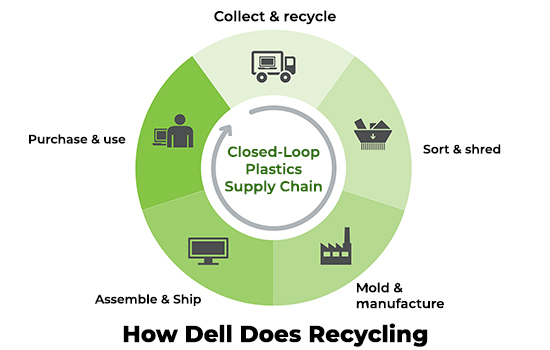
This diagram explains the closed-loop plastics supply chain that represents Dell’s recycling process. It begins with collecting and recycling products, and then it is sent for sorting and shredding. Following that, the parts are then molded and manufactured at the plant. In the next step, all the computer parts are assembled and made ready to be shipped. Finally, Dell computers are ready for purchase and sale. Overall, the recycling process is divided into five main stages.
Example 17
Sample Answer
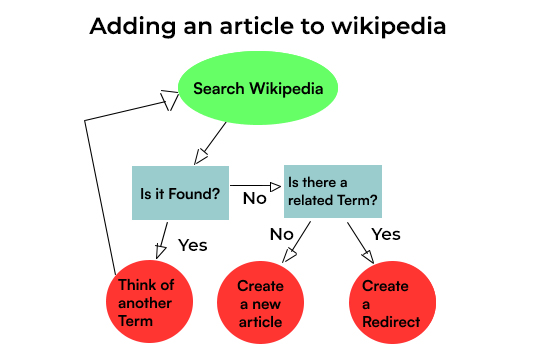
This flowchart illustrates the method of adding an article to Wikipedia. Firstly, a topic is searched on Wikipedia, and if the related topic is found, it will redirect you to think of another Term. Secondly, if the topic is not found in the library, it will search for related terms. Overall, Wikipedia allows users to add an article only if the actual term or related terms aren’t in the library.
Example 18
Sample Answer
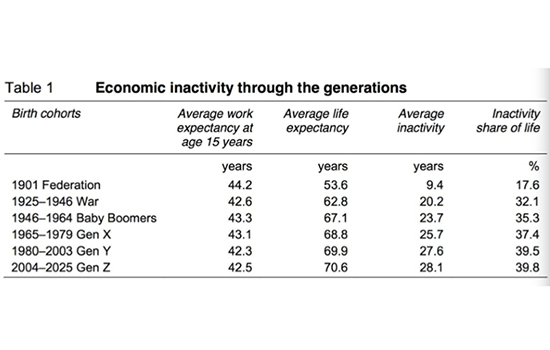
This table represents the percentage of life spent by various generations economically inactive from 1901 till 2025. It can be seen that for the year 1901, People dedicated 44.2 Years to working and spent only 17.6% of their life inactively. Furthermore, life expectancy dramatically increased from 53.6 years in 1901 to 70 years in 2025. Overall, it can be concluded that inactivity has increased with subsequent generations, and Generation Y and Generation Z are expected to spend 40% of their lives inactively.
Example 19
Sample Answer
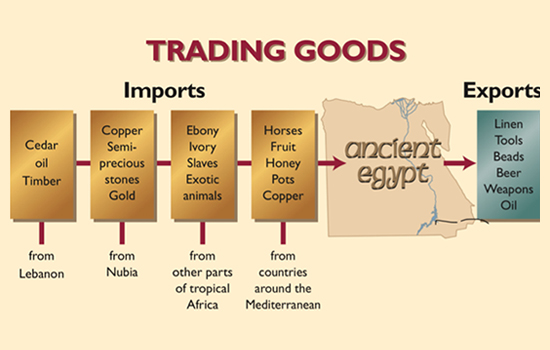
The picture here represents the trading of goods in ancient Egypt. It can be seen that Egypt Imports Cedar, oil, Timber from Lebanon, Gold, and Semi-precious stones from Nubia, Ebony, Ivory, slaves from Parts of tropical Africa, Horses, Fruits, etc., from the sea. Furthermore, It exports goods such as Linen, Tools, Beads, Beer, and oil. Overall, it can be seen that Egypt imports and exports many goods.
Example 20
Sample Answer
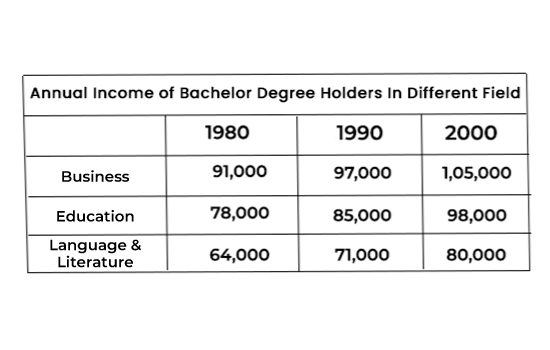
The table represents the annual income of bachelor’s degree holders in three fields: Business, education, language, and literature. In all three years, business graduates had the highest income, which was 91000 in 1980, 97000 in 1990 and 105,000 in 2000. In contrast, language and literature graduates had a minimum income of 64000 in 1980, 71000 in 1990, and 80000 in 2000. Overall, business degree holders had the highest pay in all the given years.
Get instant AI-powered analysis to track strengths, weaknesses & improve
- Personalized AI Insights – Understand your strengths & weaknesses instantly
- Smart Progress Tracking – Monitor improvement with in-depth analysis
- Boost Your Score Faster – Focus only where it matters most

Example 21
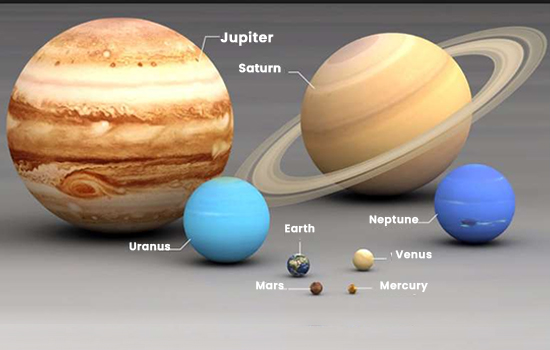
Sample Answer:
This image gives information about the solar system. It can be seen that the largest planet is Jupiter; the color is brown. Additionally, the second-largest planet is Saturn; the color is brown and it has rings around it. While, the smallest planet is Mercury, followed by Mars, Earth, Venus, Neptune, Uranus. Overall, Jupiter is the largest planet in the solar system.
Example 22
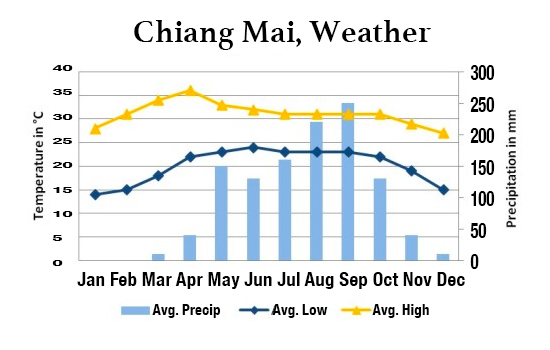
Sample Answer
This combination of bar and line graph represents the temperature in Celsius and precipitation in mm of Chiang Mai City from January to December. It can be seen that the maximum temperature of approximately 34 degrees Celsius was observed in September. Furthermore, the highest figures for an average high of 252mm and an average low of 170mm in precipitation were noted in April. Overall, there is a fluctuation seen in the figures for temperature and precipitation during a year.
Example 23
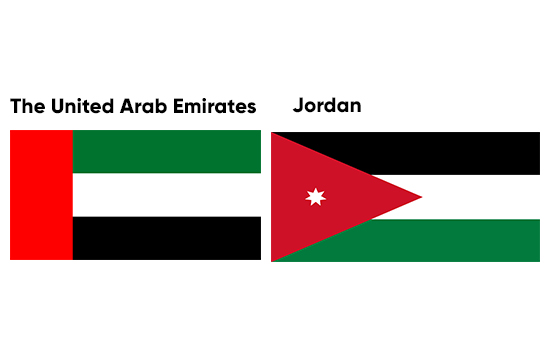
Sample Answer
The Image represents the Flag of Two Countries. It can be seen that the Flag of UAE is on the left, and the Flag of Jordan is on the Right. Also, talking about the similarities of the flags, they have common colors, i.e., Red, Green, White, and Black. The flag of the UAE is formed of four Rectangular blocks, while Jordan country\u2019s flag is composed of 3 rectangles and one triangular shape. Overall, it can be said both countries share the same color, following different shapes with red.
Example 24
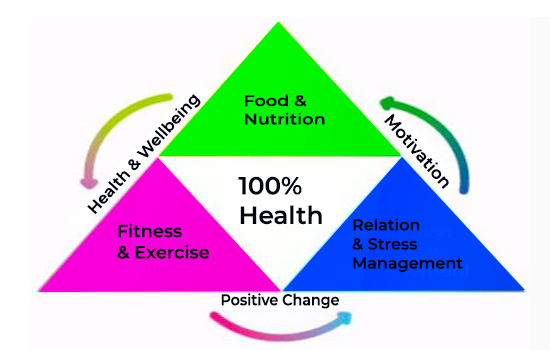
Sample Answer
The Picture represents the pyramidal graph, explaining the trick of maintaining a 100% healthy life. It can be seen that following sufficient nutrients in your diet, adding exercise to your routine, and maintaining proper relaxation are mandatory to maintain a healthy body. Also, in addition to proper well-being, upbringing, positive changes, and staying motivated are required to get these things done. Overall, it can be said that staying fit, eating, exercising, and getting proper sleep is imperative.
Example 25
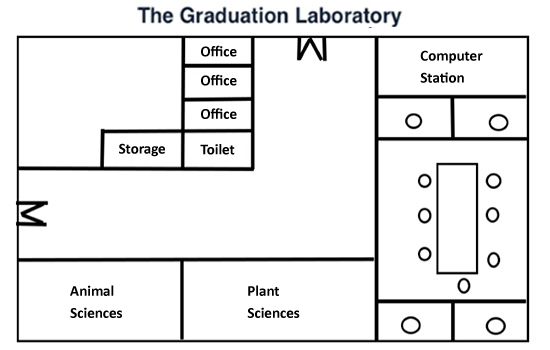
Sample Answer
The Image represents the map of a graduation laboratory. It can be seen from the map that there are two entrance gates provided in the laboratory. Furthermore, the southwest of the lab has books on animal and plant sciences. Moreover, a huge computer station covers the entire Northeast and Southeast part. Overall, it can be observed that the laboratory is designed in a structured manner, dividing book Sections and computer labs.
Example 26
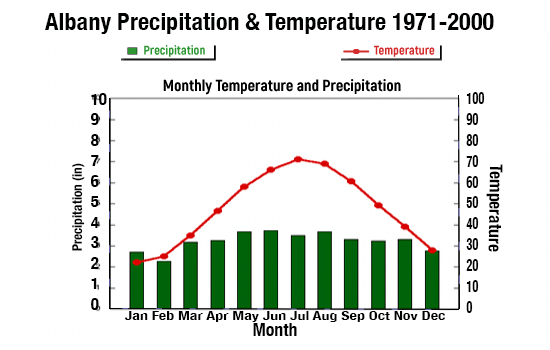
Sample Answer
The image represents Albany’s precipitation rate and temperature from 1971 to 2000. It can be seen that the precipitation rate goes maximum up to 3.5 inches. Furthermore, the temperature is observed to increase gradually from January, and after six months, the temperature starts to decline slowly. Overall, it can be seen that there is minimal difference in the precipitation rate, and the temperature is warmer in July month.
Example 27
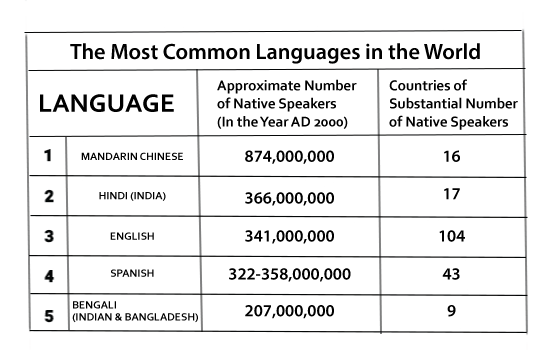
Sample Answer
The table represents the top five most common languages in the world. It can be seen that the maximum number of native speakers of Mandarin Chinese is located in 16 countries. In contrast, the lowest are Bengali speakers residing in 9 substantial countries, with approximately 207,000,000. Overall, English speakers are found across 104 countries, which is the maximum.
Example 28
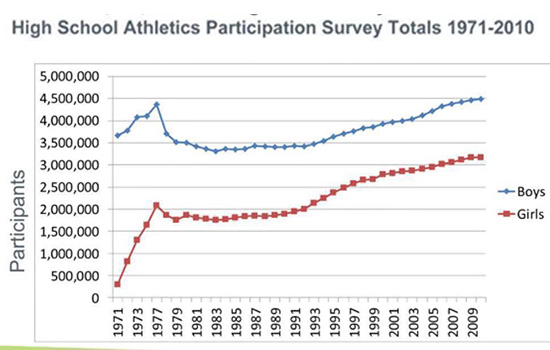
Sample Answer
The line graph represents the athletic participation survey by gender from 1971 to 2010. It can be seen that in 1971, only 250,000 girls participated, while 3,600,000 boys participated in high school Athletics. Also, in 2009, the number of girls participating in Athletics rose and reached 3,100,000, while for the same year, 4,000,000 boys participated. Overall, it can be concluded that boys were more interested in Athletics than girls.
Example 29
Sample Answer
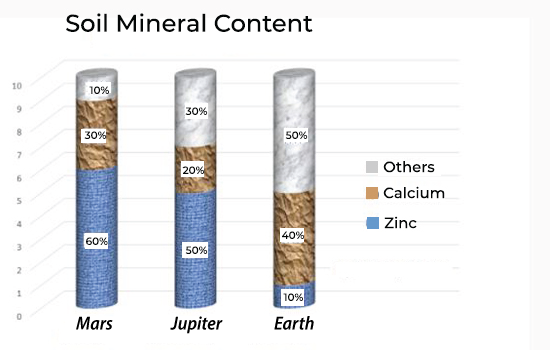
This bar graph represents the mineral content in soil on Mars, Jupiter, and Earth. It can be seen that in Mar, there is 60% zinc, 30% calcium, and 10% other minerals. While on Jupiter, the content of other minerals is more than 30%. On the other hand, on Earth the percentage of zinc is only 10%, calcium is 40% and other is 50%. The zinc content is higher on Earth than on Mars and Jupiter.
Example 30

Sample Answer
The table represents the teaching profession opted as a career. It can be seen that 95% of the maximum employed in teaching prefer teaching as a career option. Also, only 7% of the students who graduated worked as teachers. Overall, it is observed that the final-year students are least interested in teaching.
Example 31
Sample Answer
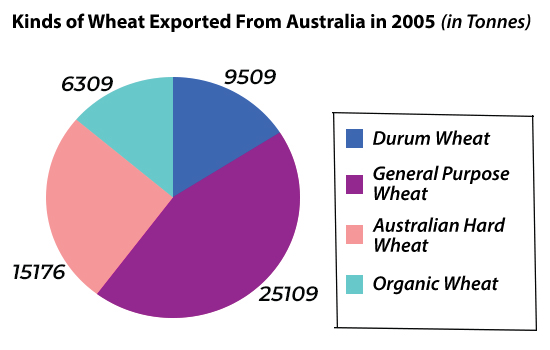
The pie chart represents the kind of wheat exported from Australia in 2005 in tonnes. It can be seen that 25,109 tonnes of wheat exported from Australia is of general purpose quality which is the maximum of all types. Overall, it can be concluded that the lowest of all types is organic wheat, the export of which is only 6309 tonnes.
Example 32
Sample Answer
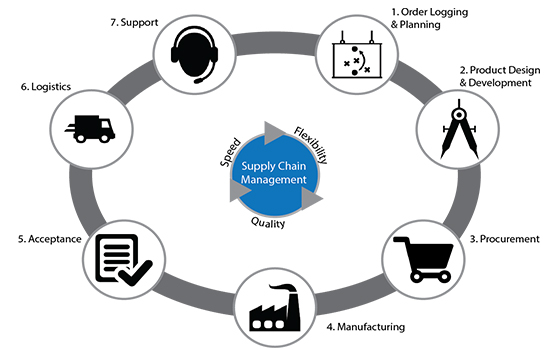
The Flowchart represents the supply chain management flow regarding flexibility, speed, and quality. The first process is logging and planning orders with product design and development. Also, after receiving the order for a manufactured product, it must be delivered through logistics. Overall, the final process required is supporting the marketed product.
Example 33
Sample Answer
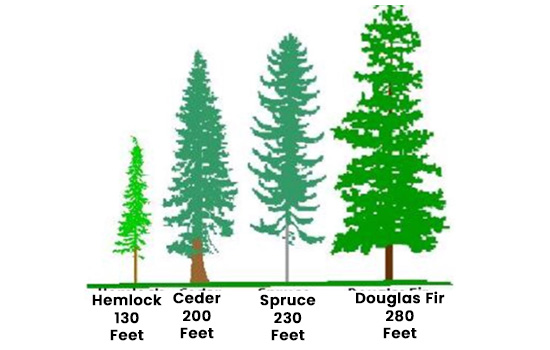
The Image represents the height of four different trees in Feet. It can be seen that the Douglas fir is the tallest of all, with 280 feet, followed by spruce and cedar, with 230 feet and 200 feet, respectively. Overall, the shortest is Hemlock, which is 130 feet tall.

Example 34
Sample Answer
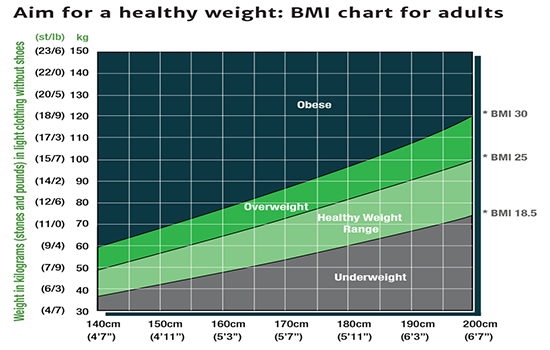
The line graph represents the BMI chart for adults aiming for a healthy weight. The chart is divided into four different categories based on weight and height. Also, a BMI of 18.5 is considered underweight, a BMI of 25 falls into the healthy weight range, a BMI of 30 is considered overweight, and a BMI above 30 falls as obese. Overall, it is necessary to maintain height and weight balance to stay healthy.
Example 35
Sample Answer
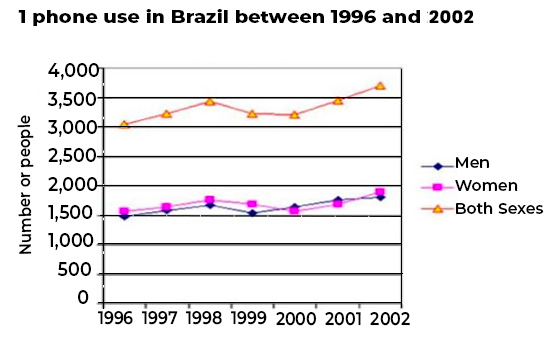
This line graph represents the cellphone use in Brazil between 1996 and 2002 by men, women, and both sexes. In 1996, around 3000 people of both sexes used cell phones in Brazil, which rose to more than 3500 people in 2002. On the other hand, almost the same number of people, both men and women, used cell phones, with nearly 1500 people in 1996 and 2000 people in 2002. Overall, there was a steady rise in the number of people using cell phones in Brazil.
Example 36
Sample Answer
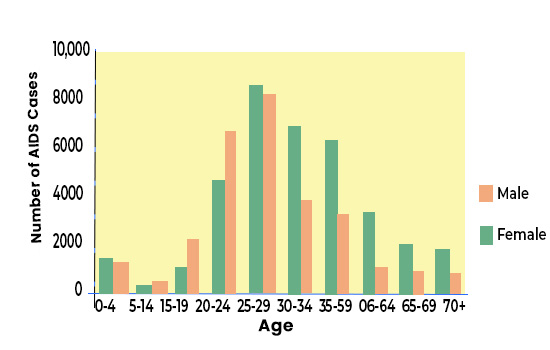
The bar graph represents the number of AIDS cases observed in the age group between zero and 70 plus. It can be seen that for both genders, the highest number of AIDS cases are seen in between the 25 to 29 age group. At the same time, the lowest cases are observed in the age group between 5 to 14. Overall, it can be concluded that the disease is more observed in males than in females.
Example 37
Sample Answer
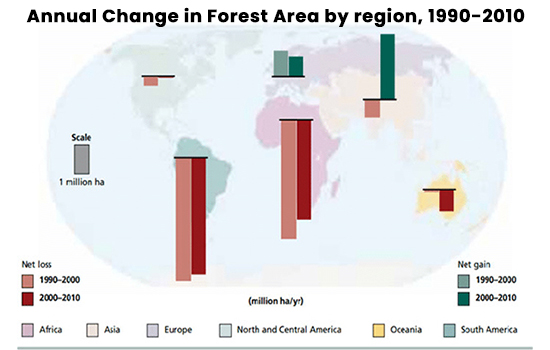
The Image represents the Annual change in Forest areas in Africa, Asia, Europe, North and Central America, Oceania, and South America. It can be seen that the highest net loss is observed in South America and Africa between the years 1990 and 2000. Meanwhile, the gain in forest area is observed to be maximum in Asia. Overall, it can be concluded that most of the area has a net loss of forest region compared to gain.
Example 38
Sample Answer
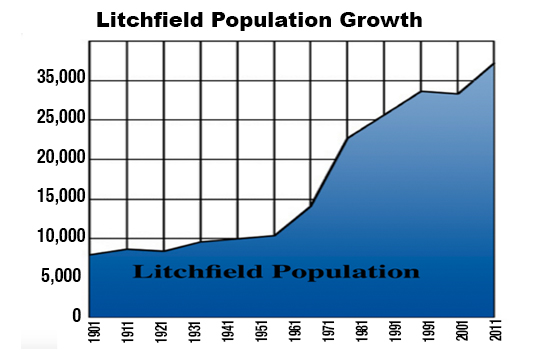
The line graph shows the population growth of Litchfield city from 1901 to 2011. It can be seen that the lowest population was observed in 1901, which was 7000. Furthermore, the graph shows that it has increased gradually over the years, and the population reached a figure close to 31,000 in 2011. Overall, with years passing by, Litchfield City is becoming a people’s residential choice.
Example 39
Sample Answer
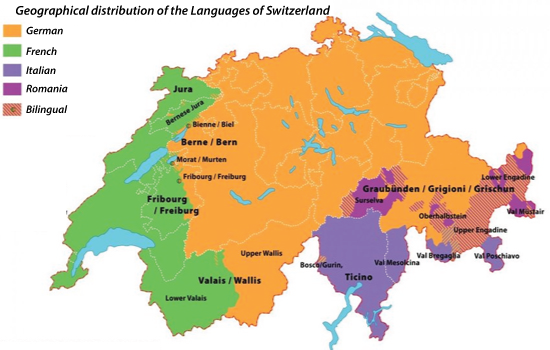
The image represents the geographical distribution of the languages of Switzerland for the year 2000. It can be seen that in Switzerland, the majority of the population speaks German. There are French-speaking people, too, located on the west side of the map. Overall, the Southeast part has more Italian than Roman speakers.
Example 40
Sample Answer
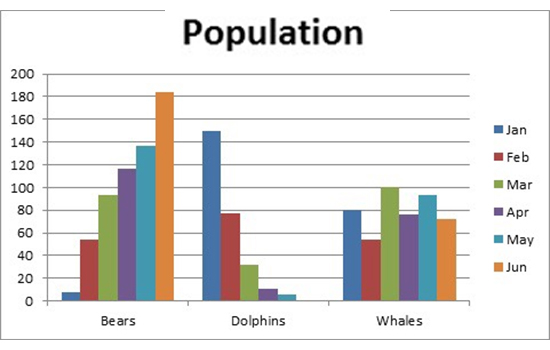
The bar graph represents the population of Bears, Dolphins, and whales from January to June month. It can be analyzed from the graph that the population of bears in January was close to 5, which dramatically increased and reached 180 by June. On the contrary, the Population of Dolphins was highest in January and nearly extinct in June. Overall, the population of whales is seen to be fluctuating between 80 and 100.
Example 41
Sample Answer
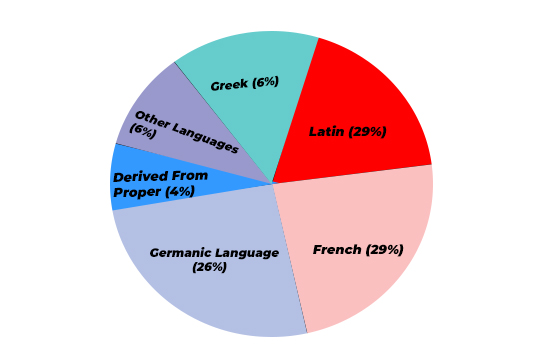
The Pie chart represents the percentage of the derivation of languages. It can be seen that Latin and French have the same proportion i.e 29 percent which is the highest, followed by German languages with 26 percent. While the languages derived from proper names consist of only 4 percent. Overall, the majority of the derivation is contributed from French, Latin, and German.
Example 42
Sample Answer
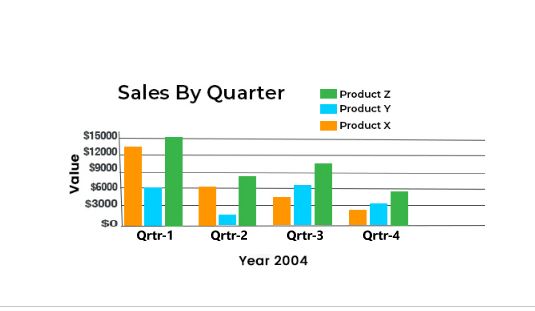
The bar graph shows the quarterly sales of Products X, Y, and z. It can be seen that the sale of product Z was the highest in Qtr1, Which is seen to be 13,000 dollars, followed by Product X, with sales accounting for 11,000 dollars. Overall, no specific trend was observed. However, product Y seems comparatively less attractive to customers.
Example 43
Sample Answer
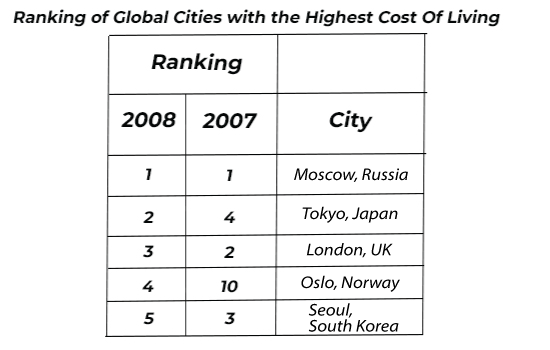
The table represents the rankings of global cities with the highest cost of living for the years 2007 and 2008. It can be seen that in both the years Russia remained at the top with the highest cost of living While in 2007, Japan which was at 4th position in 2007 became the second-highest costliest city surpassing London. Overall, a drastic change was observed in Oslo, Norway that outstripped in 2008 from number 10 to number 4.
Example 44
Sample Answer
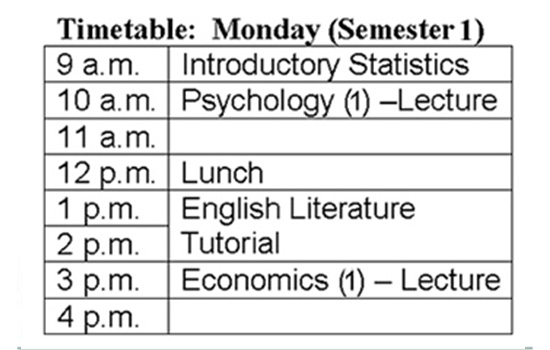
The table represents the semester one timetable for Monday. It can be seen that the lecture starts at 9 a.m., and the first lecture is on statistics, followed by a psychology lecture at 10 a.m. Then, after a lunch of 1 hour from 12 to 1 p.m., the lecture on English begins at 1 p.m. Finally, the last lecture is on the subject of economics.
Example 45
Sample Answer
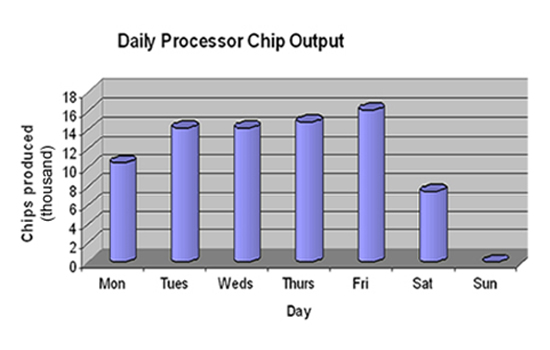
The bar graph shows the daily production of a Chip from a processor. It can be seen that the days are represented on the X-axis, and the Y-axis, chip production in thousands is represented. Also, the maximum number of chips to be produced on Friday is observed to be 16,000, while on Sunday, production is close to null. Overall, it is noticed that more chips are made from Tuesday to Friday than other days.
Example 46
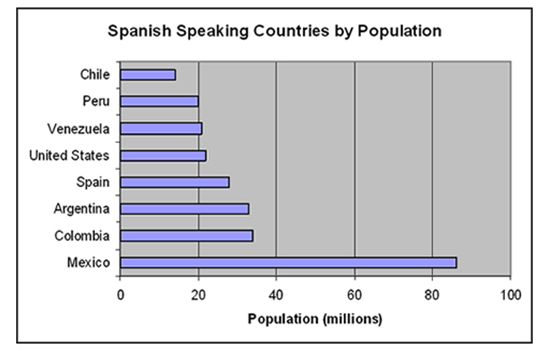
Sample Answer
The bar graph represents the Spanish-speaking countries by population. The X-axis represents the population in millions, and the Y-axis represents the countries. Also, it is observed that Mexico has 85 million people speaking Spanish, which is the highest of all countries shown, and the lowest number of Spanish-speaking people is found in Chile. Overall, countries like Mexico, Argentina, and Colombia are expected to have more Spanish-speaking populations in the future.
Example 47
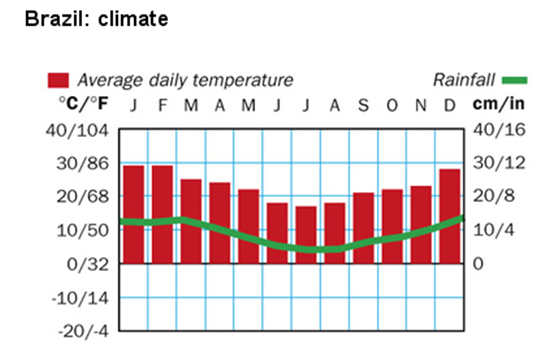
Sample Answer
The image represents the average daily temperature and rainfall in Brazil. It can be seen that the temperature in January and December is observed to be the same, which is 30 degrees Celsius. At the same time, rainfall of nearly 5 cm is observed in June and July. Overall, as the temperature increases, there is an increase in rainfall and vice-versa.
Example 48
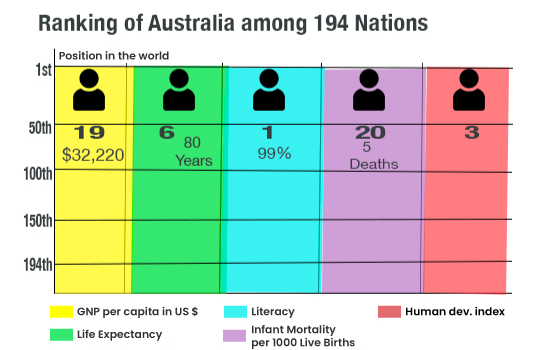
Sample Answer
The image represents Australia’s rankings among 194 nations regarding literacy, GNP per capita, life expectancy, infant mortality, and human development index. It can be seen that Australia ranked number one in literacy, with a literacy rate of 99%. At the same time, five deaths of infants per 1000 live births ranked 20th in terms of mortality rate. Overall, Australia has maintained its position in the top 20 in all terms.
Example 49
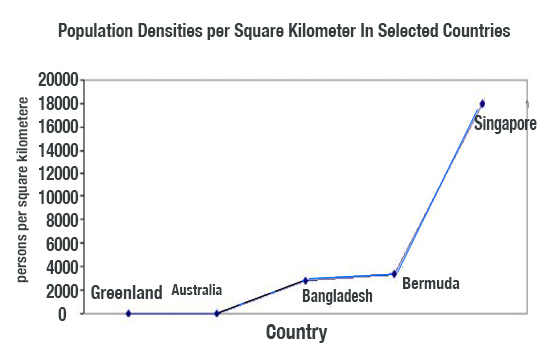
Sample Answer
The line graph represents five different countries’ population densities per square kilometer. It can be seen that the x-axis represents the country, and the y-axis represents the persons per square kilometer. The maximum number of people in Singapore is 18,000 per square kilometer. In contrast, the lowest percentage of population densities is observed in Bangladesh, which is 3000 people per square Kilometre. Overall, Greenland and Australia have close to zero population.
Example 50
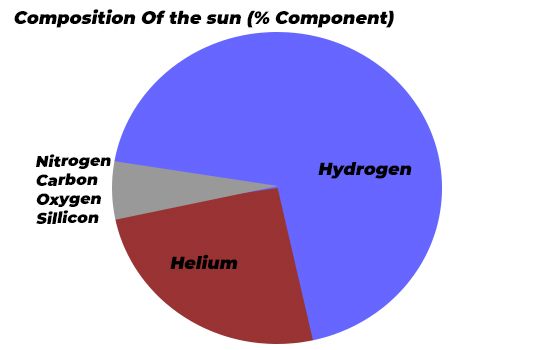
Sample Answer
The pie chart shows the percentage of components the sun comprises. It can be seen that the highest percentage of gas present in the sun is hydrogen, followed by helium. Also, very few percentages of nitrogen, carbon, oxygen, and silicon are present in the sun. Overall, it can be said that the sun is composed of hydrogen and helium.

How to score maximum marks for the PTE Describe Image question?
Well, you are aware of the exam pattern and scoring; the next thing that demands your attention is the tips and tricks to score big in the exam. So, here we go.
An adequately structured answer will get you maximum scores in the PTE exam.
The structure will include three parts.
- Introduction sentence – Introduction of the image stating the X-axis or the image’s title. For example, “This graph shows…” or “The diagram illustrates…”
- Key Points – Describe the key details. For graphs and tables, discuss trends, comparisons, and data points. For maps or diagrams, mention significant features or steps. For photographs, talk about what you see and any implications.
- Conclusion – Drawing the logical conclusion to give an overview or prediction from the data. For example, “In conclusion, this graph indicates a significant increase in…” or “Overall, the diagram demonstrates how…”
Use the right PTE describe image template
To answer this question type, one should always be prepared with an authentic PTE describe image template to score high. The template will save your time, especially when you run out of words while describing the image. It makes your answer more targeted and helps you fetch high scores in PTE.
Speak at the right time
Your response is what matters here. So, it would be best if you spoke at the right time. You will get 40 seconds to describe each image. Before this, there will be a countdown of 25 seconds.
After this countdown only, your microphone will open up. So, never start answering before the open microphone ups. Also, speaking once the allotted time is over is of no use. So, try to finish your response in 35 seconds. Speaking at the right time is as essential as speaking right.
Make most of the erasable notepad.
There are lots of elements to note down in this section. If there are bar graphs and pie charts, then there will be some readings and units mentioned. If you want to include all this in your response, using an erasable notepad is the ideal way to capture all the units and reading. Keep taking notes of all the time units and reading on this using shorthand, and you are ready to frame an in-depth response.
Practice makes you perfect.
It is imperative to test your preparations before the actual exam. Practicing in a real-time examination pattern also helps you learn about time management. That is why using the PTE mock test is what we suggest you blindly. By attempting these PTE practice tests, you will be a step closer to your areas of improvement.
But, Hold on! Just blindly performing mock tests with no improvements in the grades will not lead you to success.
It is highly recommended you integrate yourself into a one to one PTE coaching to enhance your score under the guidance of an expert. And nowadays, with the boom of the internet and digitalization, everything has become so accessible and convenient that even if you are working or a student, you can quickly join online PTE coaching that trains you at your comfort time.
Some extra dose of information
- There will be a countdown of 25 seconds before the microphone opens up to submit your answer. In those 25 seconds, try to understand the image as deeply as possible.
- You have only one chance to record your response.
- Avoid spending too much time on less important details.
- Don’t panic if you miss a point; keep your response flowing.
- Try not to use fillers (um, ah, like) excessively; it’s better to pause briefly if you need to think.
- Try to finish your response before the time ends up.
- Never label the image.
Conclusion
The Describe Image task in the PTE Speaking section can be challenging, but you can improve your score with the right PTE mock test by Gurully. Understanding the task requirements, enhancing your language skills, developing a structured approach, and practicing regularly is key to success. Stay confident, keep practicing, and aim for effective communication in your responses.
So, use these tips and tricks and score big in the PTE Describe Image section.
FAQs
How much time is allotted for the Describe Image task in PTE?
Can I use bullet points in my response for Describe Image?
Are there any specific strategies for describing charts and graphs in the Describe Image task?
What should I focus on when describing an image?
Can I use PTE describe image templates for my response?
What common mistakes should I avoid?
Also Read:
- PTE Table Chart: Tips, Template & Sample Questions with Answers to Score High
- Know Everything About PTE Rescore Success Rate, Appeal, and Technical Review Policies