

PTE Academic Describe Image is one of the most challenging tasks in the speaking section, it evaluates your ability to summarize the information visually. In this task, you will see various image types you must describe in 40 seconds. While scoring high in this task is challenging, a strong understanding of the various image types and how to approach them can boost your scores.
So here are all the types of images that you will see in PTE Describe image along with valuable tips and sample questions with answers. Know these types to achieve your target score.
1. Bar Graph Describe Image
In bar graphs, you will see rectangular bars representing the value of any data points. You have to compare quantities across different categories in these types of images.
How to describe a bar graph:
- Identify the categories: Check horizontally (x-axis) and recognize what each bar depicts.
- Note the values: Check vertically (y-axis) to see the values or data associated with each bar.
- Compare and contrast: Point out the highest and lowest bars and mention any significant trends or differences.
Sample Question:
Answer:
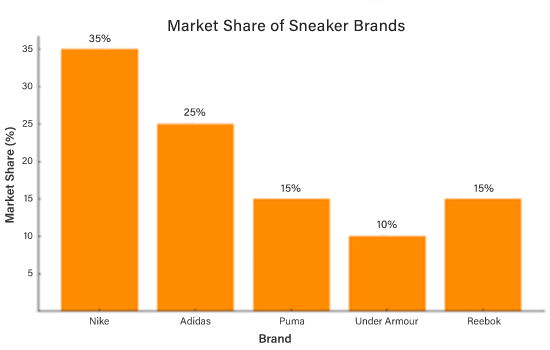
The bar chart compares the market share of popular sneaker brands. Nike dominates with a 35% share, followed by Adidas at 25%. Puma and Reebok each hold 15%, while Under Armour has the lowest market share at 10%. The chart suggests that Nike and Adidas are the most preferred brands among consumers, capturing a significant portion of the footwear industry, while other brands maintain a smaller but competitive presence.
Get instant AI-powered analysis to track strengths, weaknesses & improve
- Personalized AI Insights – Understand your strengths & weaknesses instantly
- Smart Progress Tracking – Monitor improvement with in-depth analysis
- Boost Your Score Faster – Focus only where it matters most

2. Line Graph Describe Image
In line graph images, you will encounter various data over a period of time. A series of points connected by a line will represent changes in data.
How to describe a line graph:
- Identify the timeline: Focus vertically and check the time period.
- Track the trend: Identify what is happening in the image, i.e., decreasing, increasing of fluctuating.
- Use specific data points: Describe key points like peaks, dips or trends.
Sample Question:
Answer:
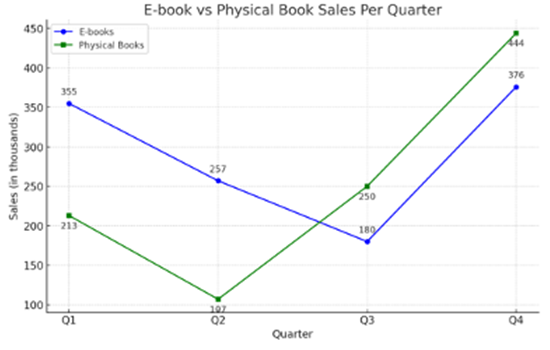
The line graph compares the quarterly sales of e-books and physical books. E-books start higher in Q1 at 355, then decline to 257 in Q2 and reach their lowest at 180 in Q3 before recovering to 376 in Q4. Physical books follow an opposite trend, starting at 213 in Q1, dropping to 107 in Q2, and then rising sharply to 444 in Q4. The data suggests that e-books have more consistent demand, while physical book sales fluctuate, peaking towards the end of the year.
3. Pie Chart Describe Image
In the PTE pie chart describe image, you will see divided segments which are representing data mostly in numerical proportion. Each segment represents a percentage of the whole.
How to describe a pie chart:
- Identify the categories: Look at the legend to see what color patterns represent.
- Highlight major segments: Observe the largest and smallest slices and any notable differences.
- Use percentages: Describe the proportions of data of each category for a clear understanding.
Sample Question:
Answer:
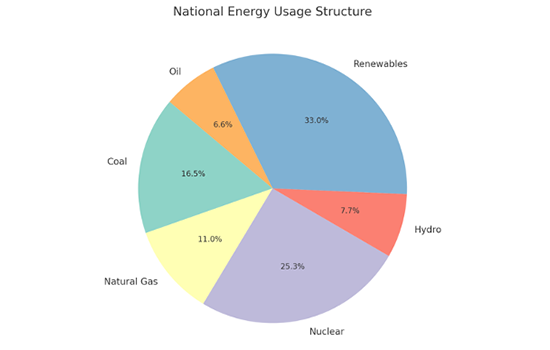
This pie chart visualizes the distribution of national energy consumption across different sources. The largest share, 33%, is attributed to renewable energy, followed by nuclear energy at 25.3%. Coal and natural gas contribute 16.5% and 11%, respectively, while hydroelectric power accounts for 7.7%. The smallest portion of energy consumption comes from oil, making up just 6.6% of the total.
4. Pictures Describe Image
In this PTE Academic describe image type you can see a photograph of a specific scene, object, or event. This type of image allows for more creative description and personal interpretation.
How to describe a picture:
Observe key details: In the image, look for objects, people, and the overall setting.
Identify the subject: Mention what is happening in the image.
Use descriptive language: Use adjectives to describe colors, shapes, and emotions to convey the mood of the image.

Sample Question:
Answer:
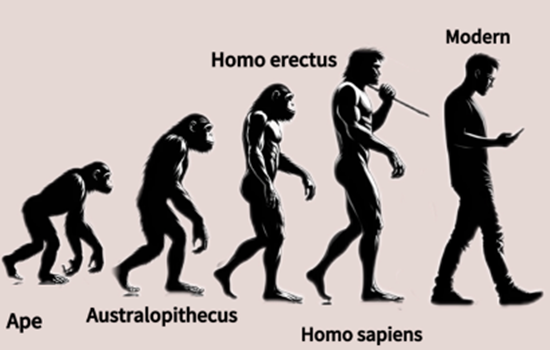
The image depicts human evolution from an ape to a modern man. It progresses through Australopithecus, Homo erectus, and Homo sapiens. The modern human is shown using a mobile phone, highlighting technological dependence. Changes include upright posture, brain size, and tool usage. It humorously contrasts primitive survival with modern habits. Overall, the image shows both biological and social evolution.
5. Tables Charts Describe Image
In this type of image, you will see data in rows and columns. As the data is already separated by rows and columns it will be easy to do comparisons.
How to describe a table:
- Identify the headings: Look at the column and row labels to understand what the table represents.
- Point out key figures: Mention any significant statistics or trends.
- Make comparisons: Highlight any major differences or patterns in the data.
Sample Question:
Answer:
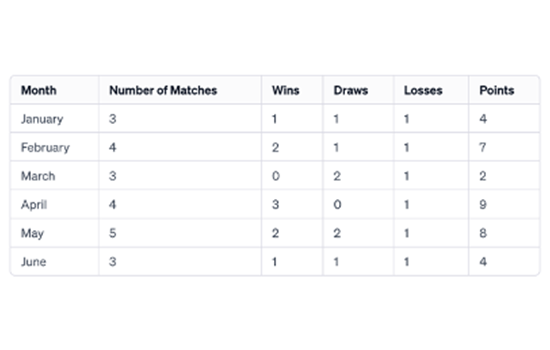
The table presents a monthly performance analysis of a sports team, showing the number of matches played, wins, draws, losses, and total points. April recorded the highest points (9), with 3 wins and 1 loss. May followed closely with 8 points from 5 matches. March had the lowest points (2), with no wins and two draws. Overall, performance fluctuated across months, with April being the most successful and March the weakest.

6. Process/Flow Charts Describe Image
A flow or process chart illustrates a sequence of steps or stages. In this type of PTE academic describe image, you have to explain complex processes in an easy-to-understand way.
How to describe a process/flow chart:
- Identify the process: Start by mentioning what the process is about.
- Describe the steps: Try to explain individual stages or steps of the image.
- Use connecting words: Words like “first,” “next,” “then,” and “finally” will help in explaining about the actions happening in the image.
Sample Question:
Answer:
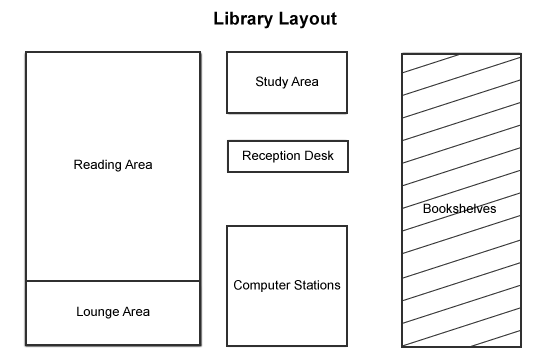
“The diagram represents the layout of a library, showing different sections for various activities. The reading area is the largest space, adjacent to a lounge area for relaxation. There are designated study areas and computer stations for research purposes. A reception desk is centrally located for assistance, while bookshelves are placed separately for easy access to materials. The layout suggests a well-organized space promoting reading, study, and digital research.
7. Map Chart Describe Image
In the Map chart, you will see geographical information, often comparing locations or changes in specific areas over time.
How to describe a map chart:
- Identify the map type: Start by stating whether the map shows a single location or a comparison of maps across different times or regions.
- Describe the features: Highlight important landmarks, regions, directions (north, south, etc.), and any visible changes if there are two maps for comparison.
- Use location-based language: Phrases like “in the north,” “to the west,” “located near,” and “surrounded by” will help to clearly explain the visual data.
Sample Question:

Answer:
The map of the U.S. presents the legal status of cannabis by state. States are color-coded to indicate whether cannabis is legal, decriminalized, or restricted to medical use. Some states have full legalization, while others allow medical use with limited THC content. A few states still prohibit cannabis entirely. The distribution suggests varying policies across the country.
How to describe a map chart:
To ace this task, constant practice is essential. You can practice PTE academic describe for free on Gurully. Our platform provides full-length PTE mock test with instant AI scoring. The scores you receive on our mock tests are typically within ±5 points of your actual PTE exam score. You can also strengthen your section by taking expert-curated section-wise exams. Subscribe to our YouTube channel for secret hacks and tips to score high in exams.
Conclusion:
In the PTE Academic Describe Image task, understanding various image types is essential for a strong performance. Each image—a graph, chart, table, or picture—requires a specific strategy for accurate description. With the right approach, even complex visuals can be described effectively. Consistent PTE practice on Gurully is the key to scoring high.
FAQ:
How many describe image in PTE exam?
Is Describe Image important in PTE?
How to get 79+ in PTE Writing?
What are common mistakes in PTE image descriptions?
What is the 3 second rule in PTE?
Also Read:
- PTE Accepted Countries for Nurses: Your Complete 2025 Guide
- Gurully’s PTE Study Material – Guide for Your Exam Success
- Practice With 70+ Most Repeated PTE Write from Dictation Questions
Free PTE Practice Test