PTE Describe Image Sample With Answers
Check PTE describe image with answers and start practicing now.
PTE
AI-Scored Mock Tests To Study And Settle Abroad.IELTS
Computer-Delivered Scored Mock Tests To Study And Settle Abroad.DUOLINGO
Score high on the most convenient English Proficiency test in the world.CELPIP
Best Platform To Meet Canadian Immigration Requirements.Boost your PTE preparation with our Describe Image examples designed to sharpen your speaking skills. Practice with a variety of images, learn how to structure responses effectively, and gain the confidence to score higher. Perfect for building fluency, vocabulary, and time management in the PTE exam.
Check PTE describe image with answers and start practicing now.

Description
The bar chart presents the number of U.S. households that own pets. The total number of pet-owning households is 84.9 million. Dogs are the most popular pets, with 63.4 million households owning them, followed by cats at 42.7 million. Freshwater fish rank third with 11.5 million, while birds, reptiles, horses, and saltwater fish have relatively lower numbers. Other pets account for 5.4 million households. The chart suggests that dogs and cats dominate pet ownership in the U.S.
Description
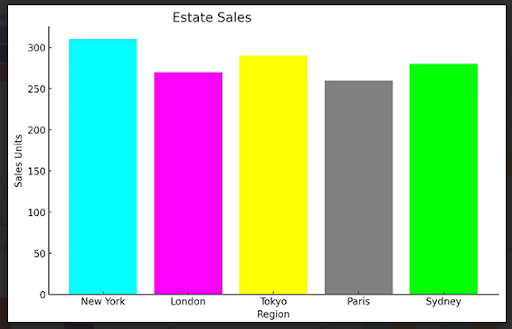
The bar chart illustrates estate sales in five cities: New York, London, Tokyo Region, Paris, and Sydney. New York recorded the highest sales, exceeding 300 units, followed closely by Tokyo Region. London and Sydney had similar figures, while Paris had the lowest sales. Overall, the chart suggests that estate sales are fairly distributed among these cities, with New York leading the market.
Description
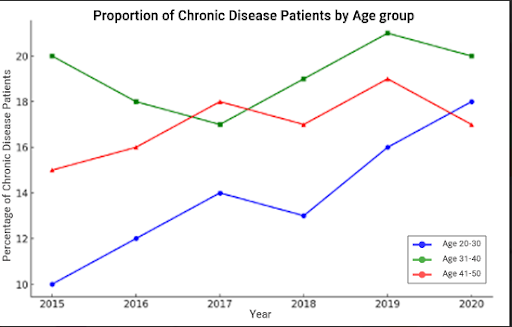
The line graph illustrates the percentage of chronic disease patients in three age groups from 2015 to 2020. The 31-40 age group consistently has the highest proportion, peaking in 2019. The 41-50 group follows a fluctuating trend, while the 20-30 group shows a steady rise. The chart indicates an increasing prevalence of chronic diseases, particularly among younger populations over time.
Description
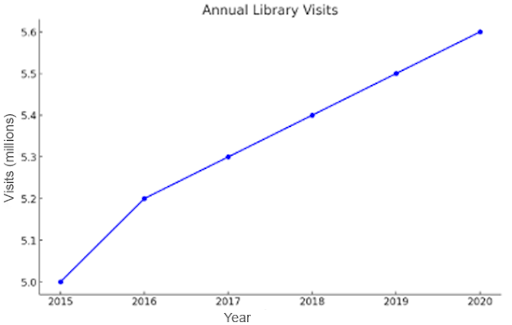
The line graph depicts the trend in annual library visits from 2015 to 2020. The number of visits starts at 5 million in 2015 and shows a consistent upward trend, reaching approximately 5.6 million by 2020. The data suggests a steady increase in library usage over the years, indicating a growing interest in library resources. Overall, the trend highlights the sustained relevance of libraries despite technological advancements.
Description
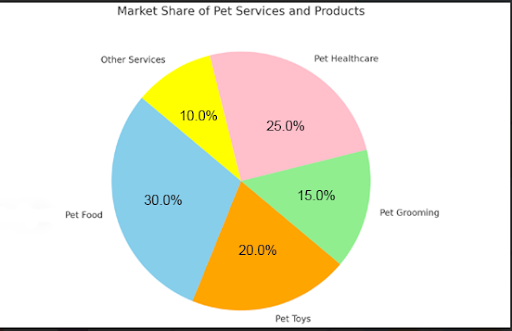
The pie chart illustrates the market share distribution of various pet services and products. Pet food holds the largest share at 30%, followed by pet healthcare at 25%. Pet toys and grooming account for 20% and 15%, respectively, while other services make up the smallest portion at 10%. The chart suggests that pet food and healthcare are the most significant sectors in the pet industry, reflecting essential spending priorities for pet owners.
Description
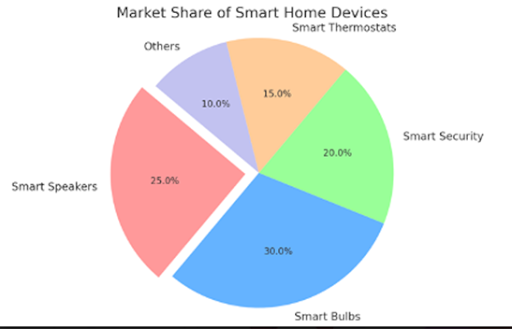
The pie chart illustrates the market share of various smart home devices. Smart bulbs hold the largest share at 30%, followed by smart speakers at 25% and smart security at 20%. Smart thermostats account for 15%, while the remaining 10% falls under other devices. The chart suggests that smart lighting and speakers dominate the market, reflecting a strong consumer preference for convenience and automation.
Description
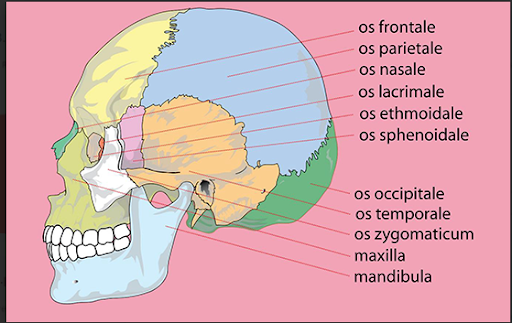
The labeled diagram presents various bones of the human skull. The major bones include the frontal, parietal, and occipital bones at the top and back. The temporal and sphenoid bones are located on the sides, while the nasal, lacrimal, and maxilla are part of the facial structure. The mandible forms the lower jaw. Overall, the image provides a detailed anatomical view of the human skull.
Description
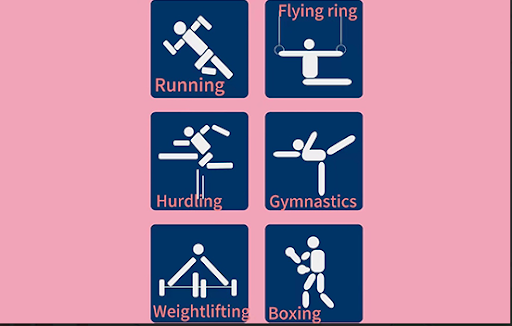
The image contains six icons representing various sports activities. The top row features running, flying ring, and hurdling, while the bottom row showcases gymnastics, weightlifting, and boxing. Each icon is designed with a minimalistic approach using a blue background and white stick-figure illustrations. The image serves as a visual representation of different athletic activities.
Description
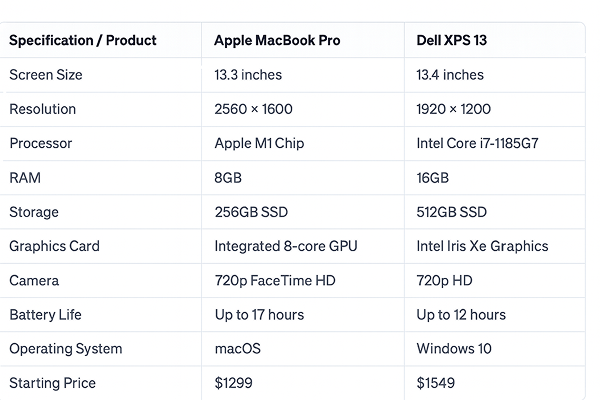
This table compares two laptops, the Apple MacBook Pro and Dell XPS 13, based on key specifications. The MacBook has a higher resolution and a longer battery life of up to 17 hours, while the Dell XPS 13 offers more RAM and storage. The MacBook uses an M1 chip, whereas the Dell runs on an Intel Core i7 processor. Both have a 720p camera, but the MacBook is more affordable at $1299, compared to $1549 for the Dell XPS 13. Overall, the MacBook excels in display and battery life, while Dell provides better performance with higher RAM and storage.
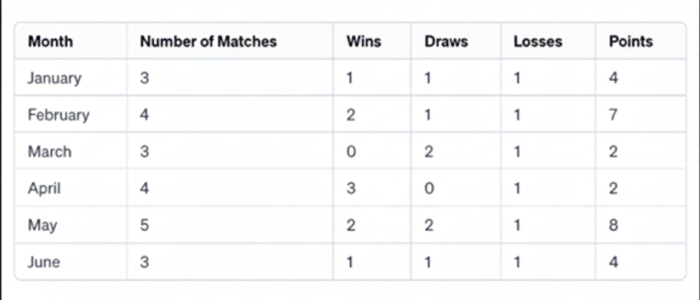
Description
The table presents a monthly performance analysis of a sports team, showing the number of matches played, wins, draws, losses, and total points. April recorded the highest points (9), with 3 wins and 1 loss. May followed closely with 8 points from 5 matches. March had the lowest points (2), with no wins and two draws. Overall, performance fluctuated across months, with April being the most successful and March the weakest.
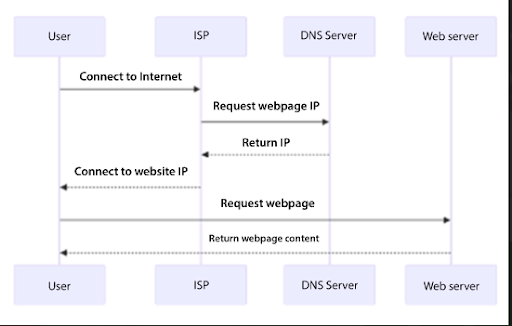
Description
This diagram explains the sequence of user actions to access a webpage. It begins with connecting to the internet; the ISP requests the webpage's IP address from a DNS server. Upon receiving the IP, the user connects to the website's IP address, requests the webpage, and ultimately receives the content, completing the browsing process.
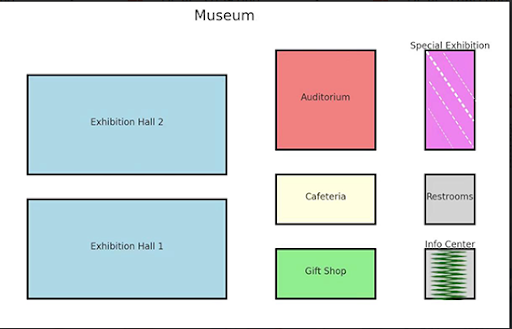
Description
The diagram illustrates the layout of a museum, categorizing different sections. The museum has two large exhibition halls showcasing artifacts. Additionally, there is an auditorium for events, a cafeteria for visitors, and a gift shop for souvenirs. A special exhibition area is designated for temporary displays, while restrooms and an information center provide visitor support. The structure suggests a visitor-friendly design, enhancing both educational and recreational experiences.
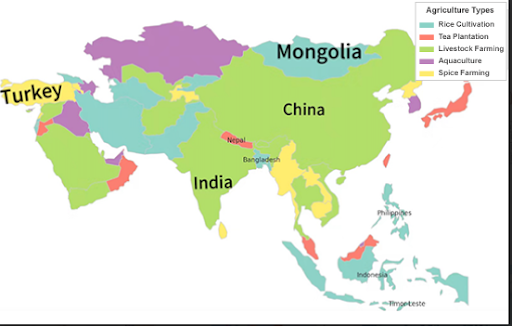
Description
The map shows how different types of agriculture are spread across Asia. Rice cultivation is mainly practiced in Mongolia, Bangladesh, Indonesia, and the Philippines. Tea plantations are concentrated in Nepal, while livestock farming dominates in China and India. Aquaculture is common in the northern parts of Asia, particularly Russia. Spice farming is carried out in Turkey and Sri Lanka. This distribution highlights how geography and local conditions influence the agricultural practices followed in different regions of Asia.
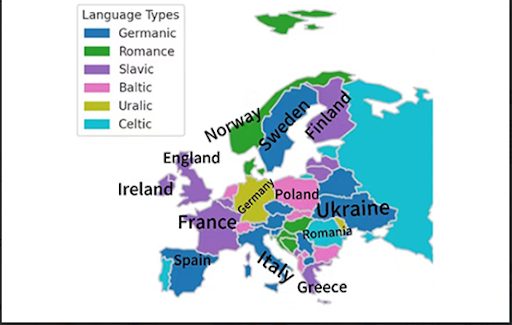
Description
The map illustrates the distribution of language families across Europe. Spain, Sweden, Italy, and Ukraine are part of the Germanic family. Norway belongs to the Romance group, while Finland, France, Ireland, and England are classified under the Slavic family. Poland represents the Baltic family, and Romania is included in the Celtic group. Overall, the map offers a clear visual representation of the linguistic classification of European countries.
Looking for more examples? go to pte-describe-image pageClick here to access 50 additional PTE Describe Image examples with answers.
Gurully's PTE Describe Image tasks are designed to mirror the actual PTE test format. You get the same timer, structure, and pressure that you'll face in the real exam, so you're not caught off guard on test day.
PTE throws charts, graphs, maps, flowcharts, and abstract pictures at you. Gurully's platform covers all these types, helping you get comfortable with different formats and not panic when something unfamiliar pops up.
Unlike generic practice, Gurully gives you instant AI scoring for fluency, pronunciation, and content. On top of that, you can also rely on expert-reviewed feedback, which pinpoints exactly what you need to improve.
Many students struggle because they can't organize their thoughts in 25 seconds. Gurully's repeated practice and sample templates help you develop strategies to describe any image confidently within the time frame.
The platform records your attempts and scores, so you can track how you're improving in fluency and accuracy over time. This motivates you and shows where you still need to push harder.
Practice with 30000+ real exam questions
