

Describe image task of the Speaking section often gives stress to students especially table chart. In this task, you will see bar graphs, flow charts, or pie charts with clear indications of trends, unlike table charts. But do not worry; you can easily score high in the PTE table chart by using the right template and tips.
Here is everything you need to impress the scoring algorithm.
PTE Table Chart Template:
Introduction:
- The table illustrates/provides information about [mention the topic or subject] across [mention time period or categories, if applicable].
Overview:
- Overall, it can be observed that [mention general trend or standout feature]. Some values are significantly higher or lower compared to others.
Key Details:
- The highest value is seen in [mention category/row/column], with [mention figure or insight].
- In contrast, the lowest figure is recorded for [mention category/row/column].
- Mention any other notable patterns, comparisons, or exceptions.
Conclusion:
- In conclusion, the table highlights [summarize key finding or contrast], indicating [implication or trend if relevant].
Tips For PTE Describe Image Table Chart
Recognize the Structure of the Table
Understand and analyze tile, headers of rows and column. Try to Check:
- Topic of the data
- What is compared or measured
- In the first 4-8 seconds try to understand the structure of the table to prepare a road map of what to say.
Start your free PTE mock test with Gurully and get AI-powered analysis for a personalized journey.
- Kickstart your PTE prep with a free AI-scored mock test
- Boost your score with in-depth analysis & smart recommendations
Look for Patterns:
Try to identify the pattern instead of getting lost in the data. Look for
- Trends (e.g., values decreasing over time)?
- Any value standing out unusually low or high
- Similarities in categories
You will easily describe valuable insights about the table by identifying these insights.
Focus on Extremes and Key Highlights
Many high scorers use this strategy for PTE table chart:
- While describing about the table, first mention maximum & minimum values.
- Next, explain significant differences or similarities between data points.
- It will show contrast and comparison, just make sure you are speaking correct numbers.
Save Time by Grouping Data:
Instead of speaking about every single value, try to:
- Group similar values together (e.g., “City 1 and City 2 show similar trends…”)
- Mention categories in pairs or sets (e.g., “In 2015 and 2016, the values remained stable…”)
Doing this will allow you to describe more about the PTE table chart within 40 seconds.
Prepare and Use Smart Vocabulary
Certain words and phrases fit well when describing tables. Here is a list of words which you can use:
| Category | Useful Phrases |
|
General Phrases |
The diagram depicts…, This visual representation shows…, As illustrated in the figure…, The data provided outlines…, This figure gives an overview of…, The graph illustrates…, The chart demonstrates…, The data reveals… |
|
Comparison Phrases |
In comparison to…, Conversely…, Unlike X, Y shows…, Whereas X increased, Y decreased…, Both X and Y experienced…, On the other hand…, While X shows…, Y demonstrates…, Likewise…, In contrast…, Similarly…, Compared to… |
|
Trend Descriptors |
Noticeable growth…, Steady upward trend…, Sudden drop…, Peaked at…, Remained unchanged…, Reached a low/high point…, Sharp rise…, Gradual fall…, Fluctuated slightly…, Significant increase…, Moderate decline…, Stable throughout… |
| Time References | During the observed period…, Over the next decade…, Throughout the years…, By the end of the period…, Between 2010 and 2020…, Over the period of…, From 2000 to 2020…, During the first half of… |
| Quantitative Language | Accounted for nearly 30%…, Approximately doubled/tripled…, Represented a minority/majority…, Was just under/over…, A marginal difference of…, A difference of 10%…, Nearly doubled…, Remained below 5 units… |
| Conclusion Phrases | To sum up the findings…, Overall, the trend indicates…, The key takeaway is that…, Summarising the data…, The primary observation is…, In summary…, Overall, it can be seen that…, To conclude… |
| Describing Extremes | The highest/lowest value was observed in…, Marked as the peak/low point…, X dominated the chart…, X showed minimal change, while Y… |
Don’t Memorize, Practice Templates with Flexibility
- Using a template is helpful, but avoid sounding robotic. Practice filling in different data with your voice and tone so it sounds natural and adaptive, not memorized. You can also do free question-wise practice on Gurully.
Record and Listen to Your Responses
While practicing, try to record yourself and identify where you are using:
- Filler words like “uh,” “um,” or “you know”
- Awkward pauses or incorrect sentence structures
- Monotone delivery (lack of emphasis on keywords)
By working on these errors, you will be able to score high in all the skill traits ofthe PTE table chart.
PTE Table Chart Sample Questions With Answers:
PTE Table Chart Sample 1
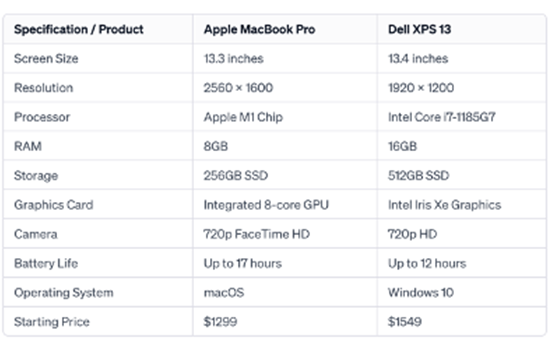
Description:
This table compares two laptops, the Apple MacBook Pro and Dell XPS 13, based on key specifications. The MacBook has a higher resolution and a longer battery life of up to 17 hours, while the Dell XPS 13 offers more RAM and storage. The MacBook uses an M1 chip, whereas the Dell runs on an Intel Core i7 processor. Both have a 720p camera, but the MacBook is more affordable at $1299, compared to $1549 for the Dell XPS 13. Overall, the MacBook excels in display and battery life, while Dell provides better performance with higher RAM and storage.
PTE Table Chart Sample 2
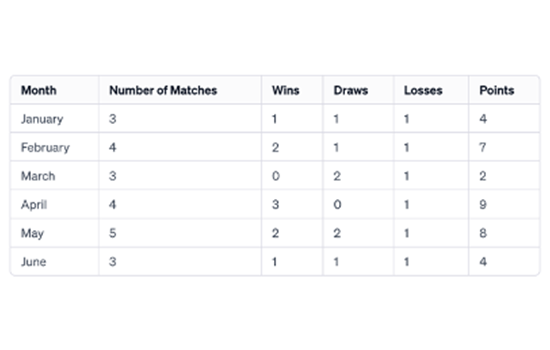
Description:
The table presents a monthly performance analysis of a sports team, showing the number of matches played, wins, draws, losses, and total points. April recorded the highest points (9), with 3 wins and 1 loss. May followed closely with 8 points from 5 matches. March had the lowest points (2), with no wins and two draws. Overall, performance fluctuated across months, with April being the most successful and March the weakest.
PTE Table Chart Sample 3
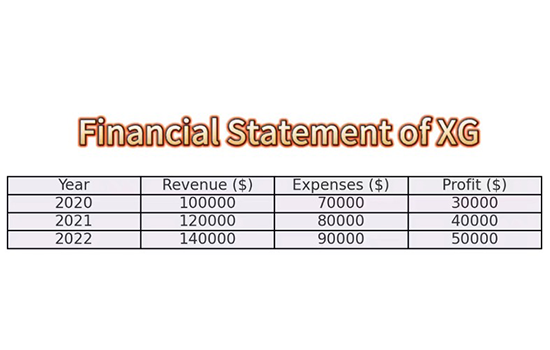
Description:
The table presents the financial statement of XG from 2020 to 2022, including revenue, expenses, and profit. Revenue increased consistently, starting at $100,000 in 2020 and reaching $140,000 in 2022. Similarly, expenses rose from $70,000 to $90,000, but the company maintained steady profit growth, increasing from $30,000 to $50,000. The overall trend suggests strong financial health, with rising revenue and profit margins. This indicates effective financial management, as the company sustained profitability despite rising operational costs.
PTE Table Chart Sample 4
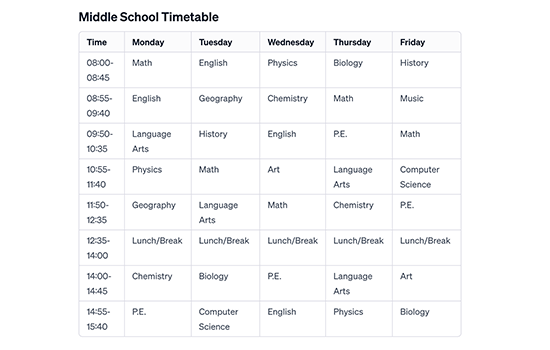
Description:
The table presents a weekly timetable for middle school students, showing subjects scheduled from Monday to Friday. Core subjects like math, English, and science appear frequently, with math scheduled every day except Wednesday. Physical education, language arts, and computer science are spread throughout the week, while music and art occur less frequently. Lunch breaks are fixed from 12:35 to 14:00 daily. The data suggests a balanced curriculum covering academic, physical, and creative subjects, ensuring holistic learning for students.
PTE Table Chart Sample 5
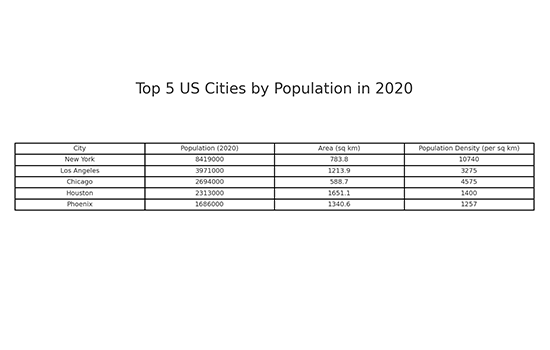
Description:
The table highlights the five most populous US cities in 2020. New York City leads with 8,419,000 residents, and Los Angeles has 3,971,000. Chicago, Houston, and Phoenix complete the list with populations of 2,694,000, 2,313,000, and 1,680,000 respectively. The table also details the Area and population density, with New York having the highest density at 10,740 people per square kilometer.

PTE Table Chart Sample 6
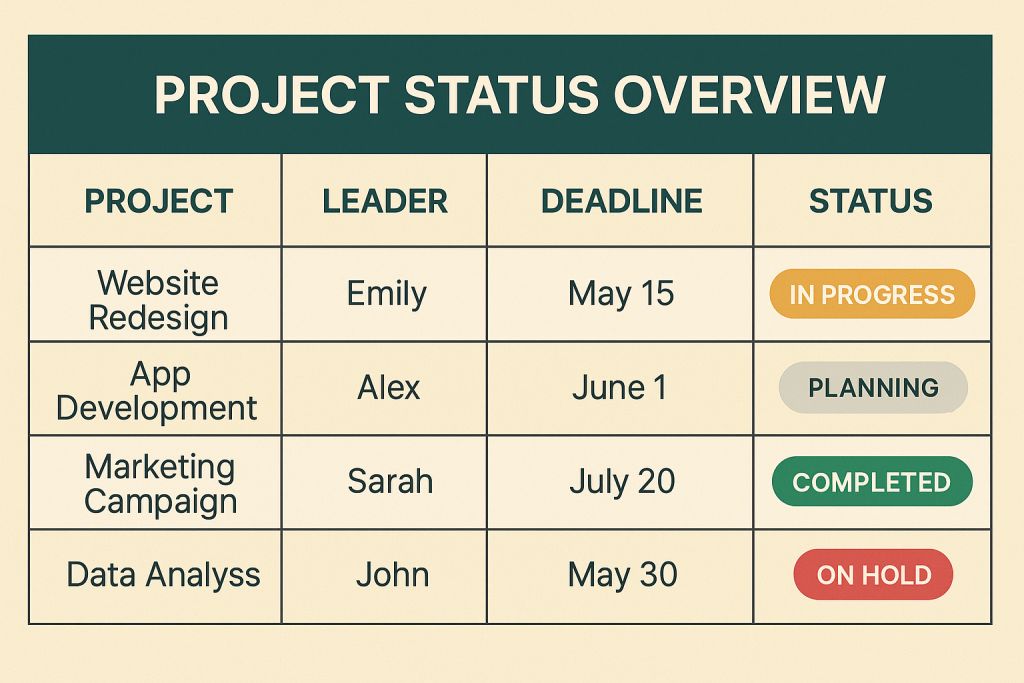
Description:
This table provides an overview of four projects, highlighting their leaders, deadlines, and current status. The Website Redesign, led by Emily, is in progress and due on May 15. App Development, managed by Alex, is in the planning phase with a June 1 deadline. The Marketing Campaign by Sarah is completed, while John’s Data Analysis project, due May 30, is on hold. Overall, the table summarizes each project’s progress and timeline.
PTE Table Chart Sample 7
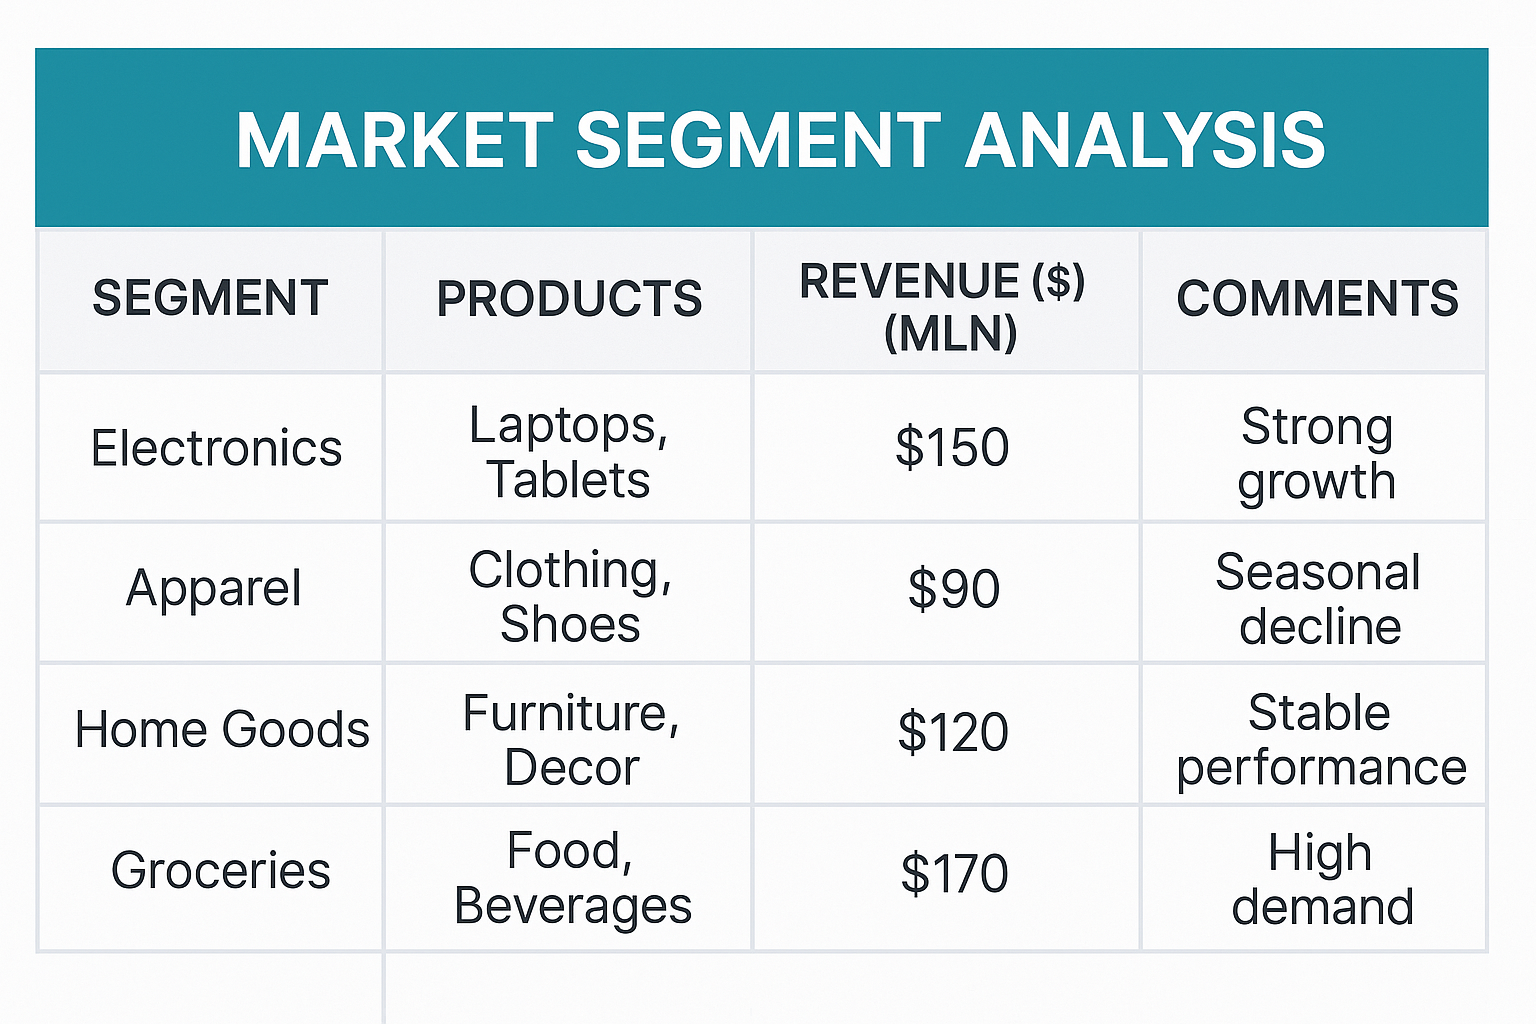
Description:
This table analyzes four market segments by products, revenue, and performance. Groceries, including food and beverages, lead with $170 million in revenue due to high demand. Electronics, such as laptops and tablets, follow with $150 million and show strong growth. Home Goods, like furniture and decor, generate $120 million with stable performance. Apparel, covering clothing and shoes, earns $90 million but faces a seasonal decline. Overall, groceries and electronics perform the strongest.
PTE Table Chart Sample 8
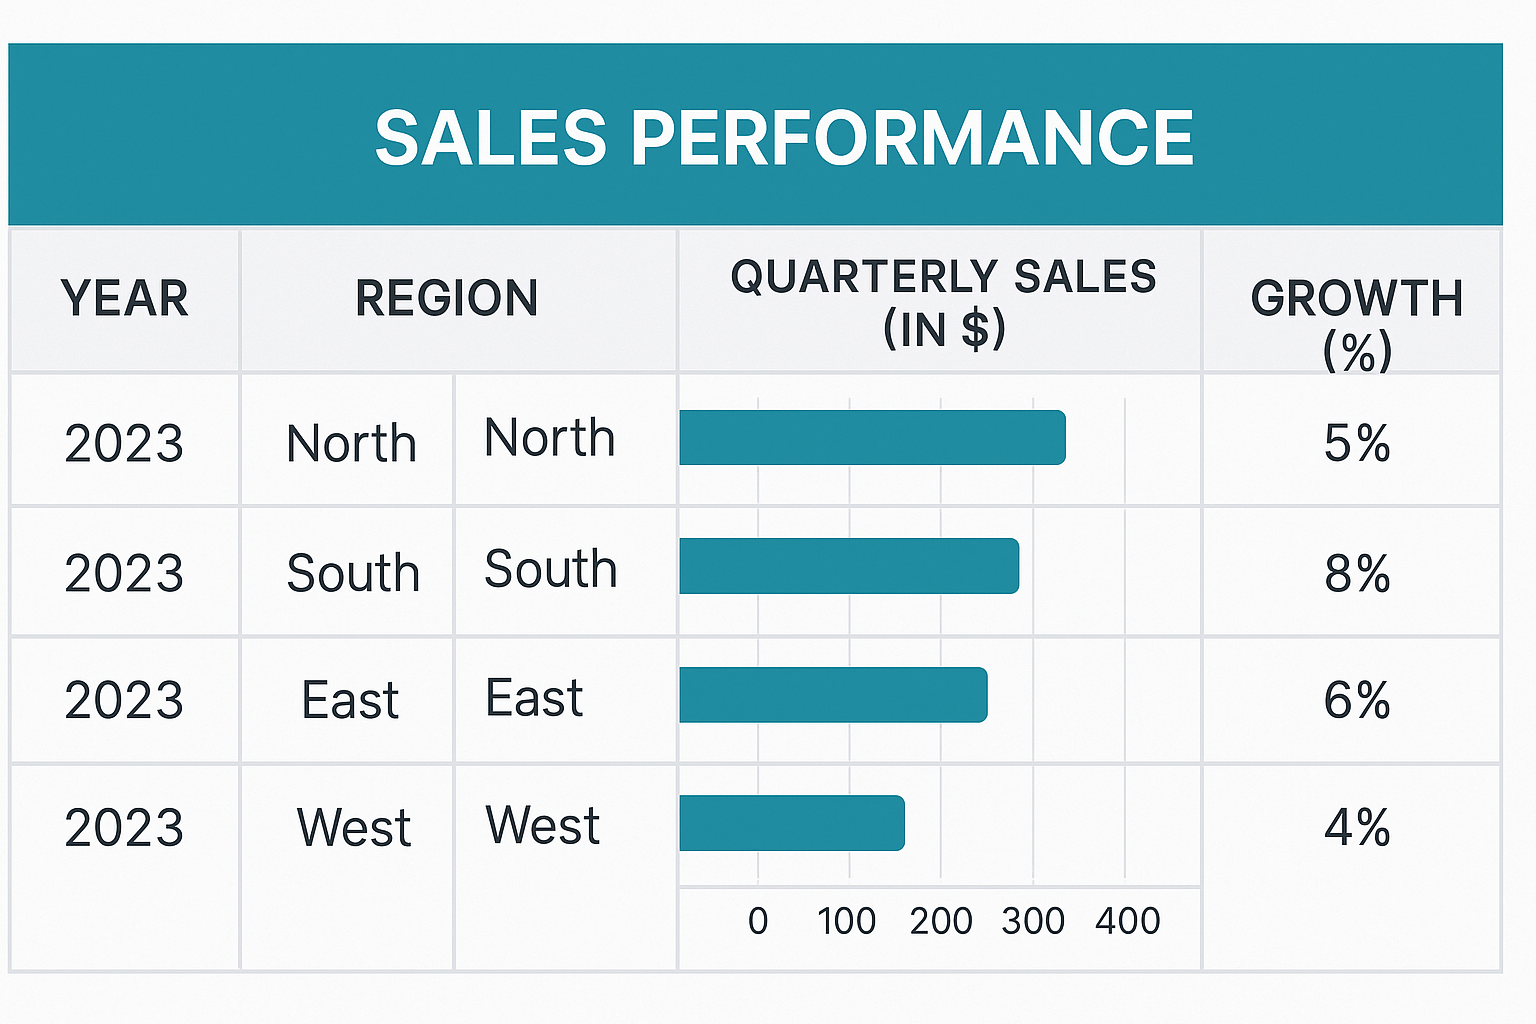
Description:
This table shows the 2023 sales performance across four regions. The North had the highest quarterly sales with 5% growth, while the South saw the highest growth rate at 8%. The East followed with steady growth of 6%, and the West recorded the lowest sales and growth, at just 4%. Overall, the South region leads in growth, while the North tops in total quarterly sales.
PTE Table Chart Sample 9
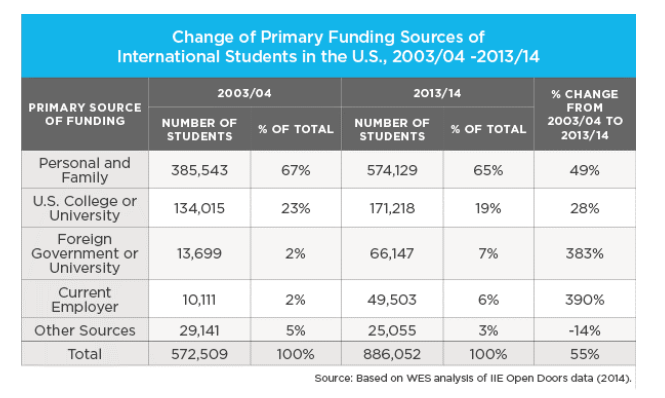
Description:
This table presents changes in the primary funding sources for international students in the U.S. between 2003/04 and 2013/14. The majority were funded by personal and family sources, increasing by 49%. Funding from U.S. colleges rose 28%, while support from foreign governments and current employers saw the most significant growth at 383% and 390%, respectively. Conversely, other sources declined by 14%. Overall, international student numbers rose by 55% during this period.
PTE Table Chart Sample 10
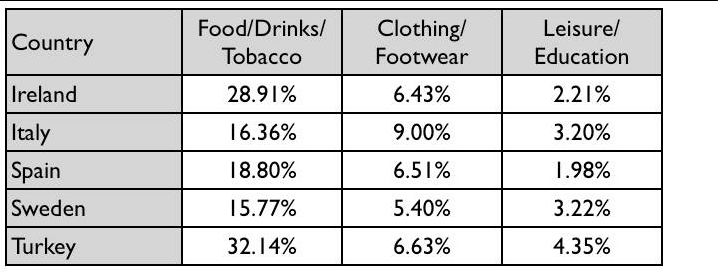
Description:
This table shows consumer spending in five countries across three categories. Turkey spends the most on food, drinks, and tobacco (32.14%), while Sweden spends the least (15.77%). For clothing and footwear, Italy leads at 9%. Leisure and education spending is highest in Turkey (4.35%) and lowest in Spain (1.98%). Overall, Turkey allocates the highest proportion across all categories, while Sweden shows the most balanced and modest spending pattern.

Consistent practice is essential to score high in the PTE Table Chart question. Gurully offers free, question-wise practice to help you master each question type individually. For comprehensive preparation, try section-wise tests to boost your performance across all sections. Take advantage of one to assess your current level. Gurully also provides full-length mock tests with AI scoring and real-time exam simulation for an actual exam experience.
Conclusion:
The PTE table chart in PTE Describe Image section may seem tricky initially, but it becomes much easier to handle with the right approach. You can deliver a confident and well-organized response by quickly identifying the structure, focusing on key trends and extremes, and using clear, relevant vocabulary. Gurully makes it easier by offering free question-wise practice and Mock test for PTE exam with real-time feedback. Consistent effort makes scoring high in the PTE table chart task possible.
FAQ:
What is the PTE Table Chart question type?
How much time do I get to prepare for the table chart?
Can I memorize a template for Describe Image tasks?
What skills are scored in the Table Chart task?
Does it affect my overall PTE score significantly?
How to score high in Describe Image in PTE?
How to describe a pie chart in PTE?
Also Read:
- PTE Academic Describe Image: Tips, Types, and Sample Question with Answers
- PTE Line Graph: Tips & Template With Most Repeated Question & Answer
- Score High in PTE Pie Chart – Template, Tips and Sample Questions with Answers
- PTE Map Chart – Tips, Template, & Sample Questions With Answers